Tracking Traffic by DNS


The video rental industry of the early 80’s was comprised of 1000’s of independent stores.  Corner video rental shops were as numerous as today’s Starbucks.  In the late 1990’s, consolidation took over.  Blockbuster with its bright blue canopy lighting up the night sky swallowed them up like doggy treats.   All the small retail outlets were gone. Blockbuster had changed everything, their economy of scale, and their chain store familiarity, had overrun the small operators.

In a similar fashion to the fledgling video rental industry, circa 1990’s Internet content was scattered across the spectrum of the web, ripe for consolidation.  I can still remember all of the geeks at my office creating and hosting their own personal websites. They used primitive tools and their own public IP’s to weave these sites together.  Movies  and music were bootlegged, and shared across a network of underground file-sharing sites.

Although we do not have one Internet “Blockbuster” today, there has been major consolidation.  Instead of all traffic coming from 100’s of thousands of personal or small niche content providers, most of it comes from the big content providers. Google, Amazon, Netflix, Facebook, Pinterest are all familiar names today.

So far I have reminisced about a nice bit of history, and I suspect you might be wondering how all of this prelude relates to tracking traffic by DNS?

Three years ago we added a DNS (domain name system) server lookup from our GUI interface, as more of a novelty than anything else. Tracking traffic by content was always a high priority for our customers, but most techniques had relied on a technology called “deep packet inspection” to identify traffic.  This technology was costly, and ineffective on its best day, but it was the only way to chase down nefarious content such as P2P.

Over the last couple of years I noticed again the world had changed. With the consolidation of content from a small number of large providers, you could now count on some consistency in the domain from which it originated.  I would often click on our DNS feature and notice a common name for my data.   For example, my YouTube videos resolved to one or two DNS names,  and I found the same to be true with my Facebook video.  We realized that this consolidation might make DNS tracking useful for our customers, and so we have now put DNS tracking into our current NetEqualizer 8.5 release.

Another benefit of tracking by domain is the fact that most encrypted data will report a valid domain.  This should help to identify traffic patterns on a network.

It will be interesting to get feedback on this feature as it hits the real world, stay tuned!

China Where Citizens Get around Internet Censorship


Screen Shot 2016-04-05 at 10.07.59 AM

By Art Reisman
CTO http://www.netequalizer.com

Over the years I have written a few articles on the perils of investing in deep packet inspection, and its coming obsolescence . One of my main points has been that tech savvy users in the US can bypass attempts to identify their traffic using encryption, thus reducing deep packet inspection firewalls into semi-comatose paper weights.

Sources for my blog articles came mostly from talking to hundreds of customers based in the US.  I have had scant information on China. My understanding of Chinese bandwidth shaping comes mostly from what I read in the papers. I have read about government sponsored censorship, plus a few of my US ex-pat customers in China have told me that there are many websites where they have been blocked.  They also have to be careful about what they say online.  I really had no idea if the average Chinese citizen resisted Internet censorship or not.

That was until a chance meeting last week.

On a plane flight from Denver to Charlotte,  I had the privilege to sit next to a recent Chinese college graduate who is currently teaching Chinese at a school here in the US. She was not a techie by any means, but obviously familiar with all the electronic social media tools that we use in the US.  I asked her if there was any problem with Internet censorship when she was in china, and before I could finish my sentence, she shrugged and half scolded me for being so “western stupid”.

We have very easy way to bypass the censorship, we use the” …. she stammered trying to come up with the English word… and then I finished her sentence . “You mean the VPN”, and then I showed her the VPN icon on my computer and she said “yes, yes, everybody does this.

Wow, what a windfall of a data point!  She obviously had no idea I had been preaching that Layer 7 was dead because VPNs cannot be easily cracked.

Even though this was just one data point and one person, I think I can infer that the use of VPN tunneling is probably widespread in China to avert China’s censorship. Another nail in the coffin of Deep Packet Inspection technology.

Virtual Internet Presence in The Netherlands, Thwarts TV Blackout


By Anonymous Guest

A few months ago I got rid of my Cable TV.  Other than a few sports networks, I never watched the other 507 channels.  Once free from that expensive local bundle, I  subscribed directly to MLB.tv for 1 year for about $100 a year, less than one months cable bill. It turned out there was one small hitch in my plan. Whenever I tried to watch my local Rockies , it is blacked out on the MLB.tv service in deference to their contractual obligations with their other distributor. ( my old cable company).  It seems the MLB.tv is smart enough to know where you are watching from based on your IP address.

Through the magic of the Internet , I now watch all my baseball games from the Netherlands, or Australia whatever Country sounds interesting. As I write my post, I am physically  in Colorado, but my virtual on-line presence for all purposes emanates from the Netherlands .  For example I went to check my local Colorado weather on weather Underground   just now, and these EU advertisements came up in the side bar. This one is from the UK but often they are in Dutch or German.

Screen Shot 2016-05-08 at 3.42.25 AM.png


Changing my virtual locations was easy, and it took about 5 minutes. First I signed up with the VPN application, IPvanish. When I fire up IPvanish it prompts me to pick a country. There are hundreds of options, next time I am going to Australia. It even shows me my connection speed.  Once IP vanish is up and running , I change my DNS server to a third-party, away from the Comcast Default. I use google’s 8.8.8.8 server. Otherwise MLB still thinks I am back in Colorado.  Lastly I clear my browsing history, and then I am set to go for tonight’s game without the black out restriction.

Seven Must Know Network Troubleshooting Tips


Screen Shot 2016-04-05 at 10.07.59 AM.png

By Art Reisman

CTO, APconnections
www.netequalizer.com

To get started you’ll need to get ahold of two key software tools: 1) Ping Tool and 2) a Network Scan Tool, both which I describe in more detail below.  And for advanced analysis (experts only), I will then show you how you can use a bandwidth shaper/sniffer if needed.

Ping Tool

Ping is a great tool to determine what your network responsiveness is (in milliseconds), identified by trying to get a response from a typical website. If you do not already know how to use Ping on your device there are hundreds of references to Ping and how to use it.  Simply google “how to use ping ” on  your favorite device or computer to learn how to use it.

For example, I found these instructions for my MAC; and there are similar instructions for Windows, iPhone, Linux, Android, etc.

  1. Open Network Utility (located inside Applications > Utilities).
  2. Click Ping.
  3. Fill out the “Enter the network that you want to ping” field. You can enter the IP address or a web URL. For example, enter http://www.bbc.co.uk/iplayer to test the ping with that website.
  4. Click Ping.

Network Scan Tool

There are a variety of network SCAN tools/apps available for just about any consumer device or computer.  The decent ones will cost a few dollars, but I have never regretted purchasing one.  I use mine often for very common home and business network issues as I will detail in the tips below. Be sure and use the term “network scan tool” when searching, so you do not get confusing results about unrelated document scanning tools.

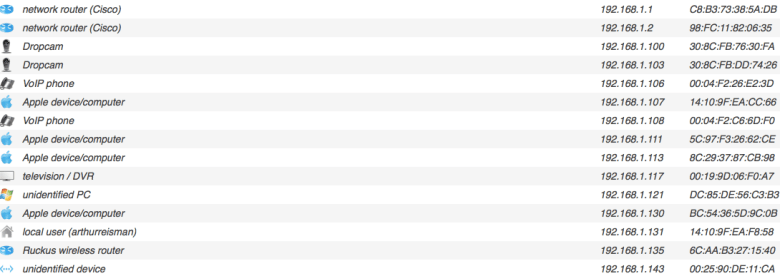
Once you get your scan tool installed, test it out by selecting Network Scan. Here is the output from my MAC scan tool.  I will be referencing this output later in the article.

Network Scan Output
Screen Shot 2016-04-05 at 5.33.19 AM


Tip #1: Using Ping to see if you are really connected to your Network

I like to open a window on my laptop and keep Ping going all day, it looks like this:

yahoo.com Ping  Output

Screen Shot 2016-04-05 at 8.25.10 AM

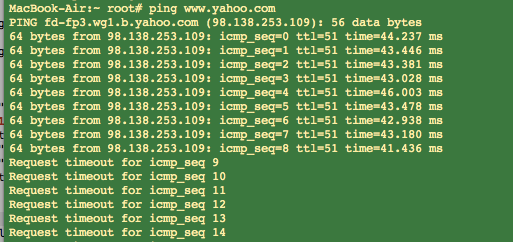
Amazingly, seemingly on cue, I lost connectivity to my Internet while I was running the tool for the screen capture above, and no, it was not planned or contrived.  I kicked off my ping by contacting http://www.yahoo.com (type in “ping http://www.yahoo.com”), a public website. And you can see that my round-trip time was around 40 milliseconds before it went dead. Any ping results under 100 milliseconds are normal.


Tip #2: How to Deal with Slow Ping Times

In the case above, my Internet Connection just went dead; it came back a minute or so later, and was most likely not related to anything local on my network.

If you start to see missed pings or slow Ping Times above 100 milliseconds, it is most likely due to congestion on your network.  To improve your response times, try turning off other devices/applications and see if that helps.  Even your TV video can suck down a good chunk of bandwidth.

Note: Always test two public websites with a ping before jumping to any conclusions. It is not likely but occasionally a big site like Yahoo will have sporadic response times.

Note: If you have a satellite link, slow and missed pings are normal just a fact-of-life.


Tip #3: If you can’t ping a public site, try pinging your local Wireless Router

To ping your local router all you need to find is the IP address of your router. And on almost all networks you can guess it quite easily by looking up the IP address of your computer, and then replacing the last number with a 1.

For example, on my computer I click on my little apple icon, then System Preferences, and then Networking, and I get this screen.  You can see in the Status are it tells me that my IP address is 192.168.1.131.

Finding my IP address output

Screen Shot 2016-04-05 at 10.52.14 AM

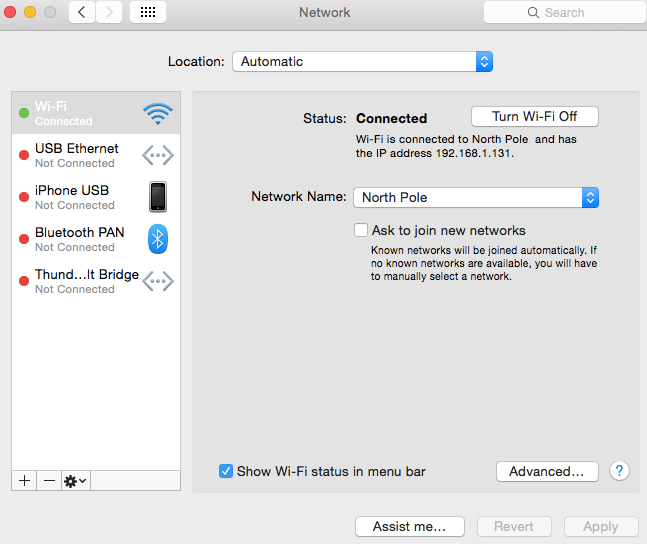
The trick to finding your router’s IP address is to replace the last number of any IP address on your network with a 1.  So in my case, I start with my IP address of 192.168.1.131, and I swap the 131 with 1.  I then ping using 192.168.1.1 as my argument, by typing in “ping 192.168.1.1”. A  ping to my router looks like this:

Router Ping  Output

Screen Shot 2016-04-05 at 10.56.30 AM

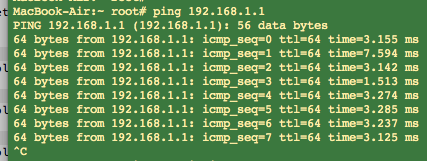
In the case above I was able to ping my local router and get a response. So what does this tell me?  If I can ping my local wireless router but I can’t ping Yahoo or any other public site, most likely the problem is with my Internet Provider.  To rule out problems with your wireless router or cables, I recommend that you re-boot your wireless router and check the cables coming into it as a next step.

In one case of failure, I actually saw a tree limb on the cable coming from the utility pole to the house. When I called my Internet Provider, I was able to relay this information, which saved a good bit of time in resolving issue.


Tip  #4: Look for IP loops

Last week I was getting an error message when I powered up my laptop, saying that some other device had my IP address, and I determined that I was unable to attach to the wireless router. WHAT a strange message!  Fortunately, with my scan tool I can see all the other devices on my network. And although I do not know exactly how I got into this situation, I was quickly able to find the device with the duplicate IP address and powercycle it. This resolved the problem in this case.


Tip #5: Look for Rogue Devices

If you never give out the security code to your wireless router, you should not have any unwanted visitors on your network.  To be certain, I again turn to the scan tool.  From my scan output, in the image above (titled “Network Scan Output” near the top of this post), you can see that there are about 15 devices attached to my network. I can account for all of them so for now I have no intruders.


Tip #6: Maybe it is just Mischief

There was a time when I left my wireless router wide open as I live in a fairly rural neighborhood and was just being complacent. I was surprised to see that one of my neighbors was on my access point, but which one?

I did some profiling.  Neighbor to my west is a judge with his own network, probably not him.  Across the street, a retired librarian, so probably not her.  That left the Neighbor to my Southwest, kitty corner, a house with all kinds of extended family coming and going, and no network router of their own, at least that I could detect. I had my suspect. And I could also assume they never suspected I was aware of them.

The proper thing to do would have been to block them and lock my wireless router. But since I wanted to have a little fun, I plugged in my bandwidth controller and set their bandwidth down to a fraction of a Megabit.  This had the effect of making their connection painfully dreadfully slow, almost unusable but with a ray of hope.  After a week, he went away and then I completely blocked him (just in case he decided to come back!).


Tip #7: Advanced Analysis with a Bandwidth Shaper/Sniffer

If the Ping tool and the Scan tool don’t shed any light on an issue, the next step is to use a more advanced Packet Sniffer. Usually this requires a separate piece of equipment that you insert into your network between your router and network users. I use my NetEqualizer because I have several of them laying around the house.

Often times the problem with your network is some rogue application consuming all of the resources. This can be in the form of consuming total bandwidth, or it could also be seen as overwhelming your wireless router with packets (there are many viruses designed to do just this).

The image below is from a live snapshot depicting bandwidth utilization on a business network. Screen Shot 2016-01-27 at 12.26.49 PM

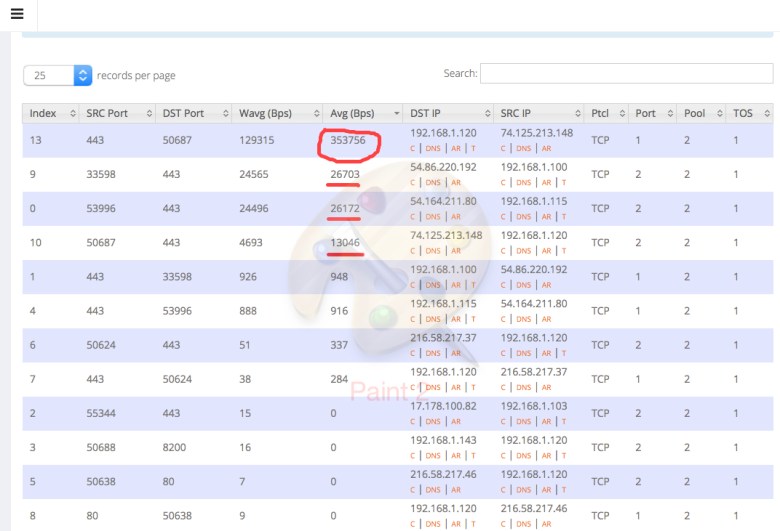
That top number, circled in red, is a YouTube video, and it is consuming about 3 megabits of bandwidth. Directly underneath that are a couple of cloud service applications from Amazon, and they are consuming 1/10 of what the YouTube video demolishes. On some lower cost Internet links one YouTube can make the service unusable to other applications.

With my sniffer I can also see total packets consumed by a device, which can be a problem on many networks if somebody opens an email with a virus. Without a sniffer it is very hard to track down the culprit.

I hope these tips help you to troubleshoot your network.  Please let us know if you have any questions or tips that you would like to contribute.

If you are ever in need of a monitoring tool visit this site

NetEqualizer DDoS Firewall: Simple and Effective without the Bloat


One of the challenges when creating a security tool is validating that it works when the S$%^ hits the fan.  We have heard (via anonymous sources) that many of the high-dollar solutions out there create bloated, rotting piles of information, whose only purpose is to look impressive due to their voluminous output.  A typical $100K buys you a CYA report. A tool that covers  everything, leaving the customer to decide what to do; which is usually nothing or some misguided “make work”. These non-specific tools are about as useful as a weather forecast that predicts everything all the time. Rain, Snow, Wind, Hot, Cold, for everyday of the year. If you predict everything you can’t be wrong?

On the other hand, the reports from the field coming in for our DDoS tool are:

Yes, it works.

Yes, it is simple to use.

Yes, it takes action when appropriate.

We have confirmation that our DDoS tool, combined with our shaping algorithms, has kept some very large institutions up and running while under very heavy, sophisticated DDoS attacks.   The reasons are simple. We look at the pattern of incoming packets in a normal situation.  When the pattern reaches a watermark that is clearly beyond normal, we block those incoming circuits. If needed, we can also take a softer approach, so the attacker is not aware we are throttling them.  This is needed because in some situations outright blocking will alert the attacker you are on to them and cause the attacker to double-down.

When under DDoS attack you don’t need reports; you need immediate action. If you would like to discuss our solution in more detail feel free to contact us.

Death to Deep Packet Inspection?


A few weeks ago, I wrote an article on how I was able to watch YouTube while on a United flight, bypassing their layer 7 filtering techniques. Following up today, I was not surprised to see a few other articles on the subject popping up recently.

Stealth VPNs By-Pass DPI

How to By Pass Deep Packet Inspection

Encryption Death to DPI

I also just recently heard from a partner company that Meraki/Cisco was abandoning their WAN DPI technology in their access points.   I am not sure from the details if this was due to poor performance from DPI , but that is what I suspect.

Lastly, even the US government is annoyed that much of the data they formally had easy access to is now being encrypted by tech companies to protect their customer base privacy.

Does this recent storm of chatter on the subject spell the end  of commercial deep packet inspection? In my opinion no, not in the near term. The lure of DPI is so strong that preaching against it is like Galileo telling the church to shove off, it is going to take some time. And technically there are still many instances where DPI works quite well.

The Technology Differences Between a Web Filter and a Traffic Shaper


First, a couple of definitions, so we are all on the same page.
A Web Filter is basically a type of specialized firewall with a configurable list of URLs.  Using a Web Filter, a Network Administrator can completely block specific web sites, or block complete categories of sites, such as pornography.

A Traffic Shaper is typically deployed to change the priority of certain kinds of traffic.  It is used where blocking traffic completely is not required, or is not an acceptable practice.  For example, the mission of a typical Traffic Shaper might be to allow users to get into their Facebook accounts, and to limit their bandwidth so as to not overshadow other more important activities.  With a shaper the idea is to limit (shape) the total amount of data traffic for a given category.

From a technology standpoint, building a Web Filter is a much easier proposition than creating a Traffic Shaper.  This is not to demean the value or effort that goes into creating a good Web Filter.  When I say “easier”, I mean this from a core technology point of view.  Building a good Web Filter product is not so much a technology challenge, but more of a data management issue. A Web Filter worth its salt must be aware of potentially millions of various websites that are ever-changing. To manage these sites, a Web Filter product must be constantly getting updated. The product company supporting the Web Filter must search the Web, constantly indexing new web sites and their contents, and then passing this information into the Web Filter product. The work is ongoing, but not necessarily daunting in terms of technology prowess.  The actual blocking of a Web site is simply a matter of comparing a requested URL against the list of forbidden web sites and blocking the request (dropping the packets).
A Traffic Shaper, on the other hand, has a more daunting task than the Web Filter. This is due to the fact that unlike the Web Filter, a Traffic Shaper kicks in after the base URL has been loaded.  I’ll walk through a generic scenario to illustrate this point.  When a user logs into their Facebook account, the first URL they hit is a well-known Facebook home page.  Their initial query request coming from their computer to the Facebook home page is easy to spot by the Web Filter, and if you block it at the first step, that is the end of the Facebook session.  Now, if you say to your Traffic Shaper “I want you to limit Facebook Traffic to 1 megabit”, then the task gets a bit trickier.  This is because once you are logged into a Facebook  page subsequent requests are not that obvious. Suppose a user downloads an image or plays a shared video from their Facebook screen. There is likely no context for the Traffic Shaper to know the URL of the video is actually coming from Facebook.  Yes, to the user it is coming from their Facebook page, but when they click the link to play the video, the Traffic Shaper only sees the video link – it is not a Facebook URL any longer. On top of that, often times the Facebook page and it’s contents are encrypted for privacy.
For these reasons a traditional Traffic Shaper inspects the packets to see what is inside.  The traditional Traffic Shaper uses Deep Packet Inspection (DPI) to look into the data packet to see if it looks like Facebook data. This is not an exact science, and with the widespread use of encryption, the ability to identify traffic with accuracy is becoming all but impossible.
The good news is that there are other heuristic ways to shape traffic that are gaining traction in the industry.  The bad news is that many end customers continue to struggle with diminishing accuracy of traditional Traffic Shapers.
For more in depth information on this subject, feel free to e-mail me at art@apconnections.net.
By Art Reisman, CTO APconnections

Firewall Recipe for DDoS Attack Prevention and Mitigation


Although you cannot “technically” stop a DDoS attack, there are ways to detect and automatically mitigate the debilitating effects on your public facing servers. Below, we shed some light on how to accomplish this without spending hundreds of thousands of dollars on a full service security solution that may be overkill for this situation.

Most of the damage done by a targeted DDoS attack is the result of the overhead incurred on your servers from large volume of  fake inquiries into your network. Often with these attacks, it is not the volume of raw bandwidth  that is the issue, but the reduced the slow response time due to the overhead on your servers. For a detailed discussion of how a DDoS attack is initiated please visit http://computer.howstuffworks.com/zombie-computer3.htm zombie-computer-3d

We assume in our recipe below, that you have some sort of firewall device on your edge that can actually count hits into your network from an outside IP, and also that you can program this device to take blocking action automatically.

Note: We provide this type of service with our NetGladiator line. As of our 8.2 software update, we also provide this in our NetEqualizer line of products.

Step 1
Calculate your base-line incoming activity. This should be a running average of unique hits per minute or perhaps per second. The important thing is that you have an idea of what is normal. Remember we are only concerned with Un-initiated hits into your network, meaning outside clients that contact you without being contacted first.

Step 2
Once you have your base hit rate of incoming queries, then set a flag to take action ( step 3 below), should this hit rate exceed more than 1.5 standard deviations above your base line.  In other words if your hit rate jumps by statistically large amount compared to your base line for no apparent reason i.e .you did not mail out a newsletter.

Step 3
You are at step 3 because you have noticed a much larger than average hit rate of un-initiated requested into your web site. Now you need to look for a hit count by external IP. We assume that the average human will only generate at most a hit every 10 seconds or so, maybe higher. And also on average they will like not generate more than 5 or 6 hits over a period of a few minutes.  Where as a hijacked client attacking your site as part of a DDOS attack is likely to hit you at a much higher rate.  Identify these incoming IP’s and go to Step 4.

Step 4
Block these IP’s on your firewall for a period of 24 hours. You don’t want to block them permanently because it is likely they are just hijacked clients ,and also if they are coming from behind a Nat’d community ( like a University) you will be blocking a larger number of users who had nothing to do with the attack.

If you follow these steps you should have a nice pro-active watch-dog on your firewall to mitigate the effects of any DDoS attack.

For further consulting on DDoS or other security related issues feel free to contact us at admin@apconnections.net.

Related Articles:

Defend your Web Server against DDoS Attacks – techrecipes.com

How DDoS Attacks Work, and Why They’re Hard to Stop

How to Launch a 65 gbps DDoS Attack – and How to Stop It

Do hotels ever block your personal wifi ?


Apparently at least one hotel does. We had written an article hinting that this might be the case  back in 2010.  Hotel operators at the time were hurting from the loss of phone call charges as customers turned to their cell phones, and were looking for creative ways to charge for Internet service.

Hence I was not surprised to see this article today.

FCC: Marriott blocked guests’ personal Wi-Fi, charged for Net access

Federal Communications Commission fines Marriott $600,000 after deciding it illegally interfered with conventiongoers’ hot spots in Nashville. Marriott says it did nothing wrong.

In its judgment, the FCC said “Marriott employees had used containment features of a Wi-Fi monitoring system at the Gaylord Opryland to prevent individuals from connecting to the Internet via their own personal Wi-Fi networks, while at the same time charging consumers, small businesses and exhibitors as much as $1,000 per device to access Marriott’s Wi-Fi network.”

read more

How to keep your IP address static with DHCP


One of the features we support with the NetEqualizer product is a Quota tool, which keeps a running count of total bytes used per IP on a network. A typical IT administrator wants to keep track of data on a per user basis over time, hence some form of Quota tool is essential.  However, a potential drawback of our methodology is that we track usage by IP.   Most networks use a technology called DHCP that dynamically hands out a new IP address each time you power up and power down your computer or wireless device. Most network administrators can track a specific user to an IP in the moment, but they have no idea who had the IP address last week or last month.  Note: there are authentication tools such as Radius or Nomadix that can be used to track users by name but, this adds a complex layer of additional overhead to a simple network.

Yesterday, when working with a customer, the subject came up about our Quota tool, and its drawback of not being able to track a user by IP over time, and the customer turned that into a teaching moment for me.

You see, a DHCP server will always try and give the same IP address back to the same device if the previous IP address is available.   So the key is keeping that IP address available; and there is a simple trick to make sure that this happens.

When you set up a DHCP server it will ask you the range of IP addresses you want to use. All one needs to do is ensure that the defined range is much bigger than the number of devices that will be on your network, and then you can be almost certain that a device will always get the same IP.  This is because the DHCP server only re-uses previously assigned IP addresses when all IP addresses have been assigned, and this would only happen if you defined your IP address range to a relative small number relative to the number of potential devices on your network.   There is no real extra cost for defining your DHCP address range as a Class B instead of the typical default Class C, which then expands your range from 255 to 64,000.  So make sure your ranges are large enough and feel free to track your users by IP without worry.

If you would like to learn more about our Quota tool, also known as “User Quota”, you can read more about it in our User Guide.

Is Layer 7 Shaping Officially Dead ?


Sometimes life throws you a curve ball and you must change directions.

We have some nice color coded pie chart  graphs that show customers percentages of  their bandwidth by application. This feature is popular  really catches their eye.

In an effort to improve our latest layer 7  reporting feature, we have been collecting data from some of our Beta users.

Layer 7 PIe Chart

Layer 7 PIe Chart 

The  accuracy of the Layer 7 data has always and continues to be an issue. Normally this is resolved by revising the layer 7 protocol patterns, which we use internally to identify the signatures of various applications.   We  had anticipated and planned to address accuracy in  a second release. However when we start to look at the root cause as to what is causing the missed classifications, we start to  see more cases of encrypted data. Encrypted data cannot be identified.

We then checked with one of our ISP customers in South Africa , who handles over a million residential users. It seems that some of their investment in Layer 7 classification is also being thwarted by increased encryption. And this is more  than the traditional p2p traffic,  encryption has spread to  the common social services such as face book.

Admittedly some of this early data is anecdotal,  but two independent observers reporting increased encryption is hard to ignore.

Evidently the increased encryption techniques now being used by common applications,  is a back lash to all the security issues bogging down the Internet.  There are workarounds for enterprises that must use layer 7 classification to prioritize traffic; however the workarounds require that all devices using the network must be retrofitted with special software to identify the traffic on the device ( iPad, iPhone). Such a workaround is impractical for an ISP.

The net side effect is, that if this trend continues traditional layer 7 packet shapers will become museum pieces right beside old Atari Games, and giant 3 pound cell phones.

How Many Users Can Your High Density Wireless Network Support? Find Out Before you Deploy.


By

Art Reisman

CTO http://www.netequalizer.com

Recently I wrote an article on how tough it has become to deploy wireless technology in high density areas.  It is difficult to predict final densities until fully deployed, and often this leads to missed performance expectations.

In a strange coincidence, while checking  in with my friends over at Candela Technologies last Friday , I was not  surprised to learn that their latest offering ,the Wiser-50 Mobile Wireless Network Emulator,  is taking the industry by storm.  

So how does their wireless emulator work and why would you need one ?

The Wiser-50  allows you to take your chosen access points, load them up with realistic  signals from a densely packed area of users, and play out different load scenarios without actually building out the network . The ability to this type of emulation  allows you to make adjustments to your design on paper without the costly trial and error of field trials.  You will be able to  see how your access points will behave under load  before you deploy them.  You can then make some reasonable assumptions on how densely to place your access points,  and more importantly get an idea on the upper bounds of your final network.

With IT deployments  scaling up into new territories of  densities, an investment in a wireless emulation tool will pay for itself many times over.  Especially when bidding on a project. The ability to justify how you have sized a quality solution over an ad-hock random solution, will allow your customer to make informed decisions on the trade -offs in wireless investment.

The technical capabilities of Wiser-50 are listed below.   If you are not familiar with all the terms involved with wireless testing I would suggest a call to Candelatech network engineers, they have years of experience helping all levels of customers and are extremely patient and easy to work with.

Scenario Definition Tool/Visualization

  • Complete Scenario Definition to add nodes, create mobility vectors and traffic profiles for run-time executable emulation.
  • Runtime GUI visualization with mobility and different link and traffic conditions.
  • Automatic Traffic generation & execution through the GUI.
  • Drag-and-drop capability for re-positioning of nodes.
  • Scenario consistency checks (against node capabilities and physical limitations such as speed of vehicle).
  • Mock-up run of the defined scenario (i.e., run that does not involve the emulator core to look at the scenario)
  • Manipulation of groups of nodes (positioning, movement as a group)
  • Capture and replay log files via GUI.
  • Support for 5/6 pre-defined scenarios.

RF Module

  • Support for TIREM, exponent-based, shadowing, fading, rain models (not included in base package.)
  • Support for adaptive modulation/coding for BER targets for ground-ground links.
  • Support for ground-to-ground & satellite waveforms
  • Support for MA TDMA (variants for ground-ground, ground-air & satellite links).
  • Support for minimal CSMA/CA functionality.
  • Support to add effects of selective ARQ & re-transmissions for the TDMA MAC.

Image

Related Articles

The Wireless Density Problem

Wireless Network Capacity Never Ending Quest Cisco Blog

Internet User’s Bill of Rights


This is the second article in our series. Our first was a Bill of Rights dictating the etiquette of software updates. We continue with a proposed Bill of Rights for consumers with respect to their Internet service.

1) Providers must divulge the contention ratio of their service.

At the core of all Internet service is a balancing act between the number of people that are sharing a resource and how much of that resource is available.

For example, a typical provider starts out with a big pipe of Internet access that is shared via exchange points with other large providers. They then subdivide this access out to their customers in ever smaller chunks — perhaps starting with a gigabit exchange point and then narrowing down to a 10 megabit local pipe that is shared with customers across a subdivision or area of town.

The speed you, the customer, can attain is limited to how many people might be sharing that 10 megabit local pipe at any one time. If you are promised one megabit service, it is likely that your provider would have you share your trunk with more than 10 subscribers and take advantage of the natural usage behavior, which assumes that not all users are active at one time.

The exact contention ratio will vary widely from area to area, but from experience, your provider will want to maximize the number of subscribers who can share the pipe, while minimizing service complaints due to a slow network. In some cases, I have seen as many as 1,000 subscribers sharing 10 megabits. This is a bit extreme, but even with a ratio as high as this, subscribers will average much faster speeds when compared to dial up.

2) Service speeds should be based on the amount of bandwidth available at the providers exchange point and NOT the last mile.

Even if your neighborhood (last mile) link remains clear, your provider’s connection can become saturated at its exchange point. The Internet is made up of different provider networks and backbones. If you send an e-mail to a friend who receives service from a company other than your provider, then your ISP must send that data on to another network at an exchange point. The speed of an exchange point is not infinite, but is dictated by the type of switching equipment. If the exchange point traffic exceeds the capacity of the switch or receiving carrier, then traffic will slow.

3) No preferential treatment to speed test sites.

It is possible for an ISP to give preferential treatment to individual speed test sites. Providers have all sorts of tools at their disposal to allow and disallow certain kinds of traffic. There should never be any preferential treatment to a speed test site.

4) No deliberate re-routing of traffic.

Another common tactic to save resources at the exchange points of a provider is to re-route file-sharing requests to stay within their network. For example, if you were using a common file-sharing application such as BitTorrent, and you were looking some non-copyrighted material, it would be in your best interest to contact resources all over the world to ensure the fastest download.

However, if your provider can keep you on their network, they can avoid clogging their exchange points. Since companies keep tabs on how much traffic they exchange in a balance sheet, making up for surpluses with cash, it is in their interest to keep traffic confined to their network, if possible.

5) Clearly disclose any time of day bandwidth restrictions.

The ability to increase bandwidth for a short period of time and then slow you down if you persist at downloading is another trick ISPs can use. Sometimes they call this burst speed, which can mean speeds being increased up to five megabits, and they make this sort of behavior look like a consumer benefit. Perhaps Internet usage will seem a bit faster, but it is really a marketing tool that allows ISPs to advertise higher connection speeds – even though these speeds can be sporadic and short-lived.

For example, you may only be able to attain five megabits at 12:00 a.m. on Tuesdays, or some other random unknown times. Your provider is likely just letting users have access to higher speeds at times of low usage. On the other hand, during busier times of day, it is rare that these higher speeds will be available.

There is now a consortium called M-Lab which has put together a sophisticated speed test site designed to give specific details on what your ISP is doing to your connection. See the article below for more information.

Related article Ten things your internet provider does not want you to know.

Related article On line shoppers bill of rights

Best Monitoring Tool for Your Network May Not Be What You Think


By Art Reisman

CTO – http://www.netequalizer.com

A common assumption in the IT world is that the starting point for any network congestion solution begins with a monitoring tool.  “We must first figure out what specific type of traffic is dominating our network, and then we’ll decide on the solution”.  This is a reasonable and rational approach for a one time problem. However, the source of network congestion can change daily, and it can be a different type of traffic or different user dominating your bandwidth each day.

When you start to look at the labor and capital expense of  “monitor and react,” as your daily troubleshooting tool, the solution can become more expensive than your bandwidth contract with your provider.

The traditional way of looking at monitoring your Internet has two dimensions. First, the fixed cost of the monitoring tool used to identify traffic, and second, the labor associated with devising and implementing the remedy. In an ironic inverse correlation, we assert that your ROI will degrade with the complexity of the monitoring tool.

Obviously, the more detailed the reporting/shaping tool, the more expensive its initial price tag. Yet, the real kicker comes with part two. The more detailed data output generally leads to an increase in the time an administrator is likely to spend making adjustments and looking for optimal performance.

But, is it really fair to assume higher labor costs with more advanced monitoring and information?

Well, obviously it wouldn’t make sense to pay more for an advanced tool if there was no intention of doing anything with the detailed information it provides. But, typically, the more information an admin has about a network, the more inclined he or she might be to spend time making adjustments.

On a similar note, an oversight often made with labor costs is the belief that when the work needed to adjust the network comes to fruition, the associated adjustments can remain statically in place. In reality, network traffic changes constantly, and thus the tuning so meticulously performed on Monday may be obsolete by Friday.

Does this mean that the overall productivity of using a bandwidth monitoring tool is a loss? Not at all. Bandwidth monitoring and network adjusting can certainly result in a cost-effective solution. But, where is the tipping point? When does a monitoring solution create more costs than it saves?

The solution: Be proactive, use a tool that prevents congestion before it affects the quality of your network.

An effective compromise with many of our customers is that they are stepping down from expensive, complex reporting tools to a simpler approach. Instead of trying to determine every type of traffic on a network by type, time of day, etc., an admin can head off trouble with a basic bandwidth control solution in place (such as a NetEqualizer). With a smart, proactive congestion control device, the acute problems of a network locking up will stop.

Yes, there may be a need to look at your overall bandwidth usage trends over time, but you do not need an expensive detailed monitoring tool for that purpose.

Here are some other articles on bandwidth monitoring that we recommend.

List of monitoring tools compiled by Stanford.

ROI tool , determine how much a bandwidth control device can save.

Great article on choosing a bandwidth controller.

Planetmy
Linux Tips
How to set up a monitor for free

Good enough is better: a lesson from the Digital Camera Revolution

%d bloggers like this: