Covid-19 and Increased Internet Usage


Our sympathies go out to everyone who has been impacted by Covid 19, whether you had it personally or it affected your family and friends. I personally lost a sister to Covid-19 complications back in May; hence I take this virus very seriously.

The question I ask myself now as we see a light at the end of the Covid-19 tunnel with the anticipated vaccines next month is, how has Covid-19 changed the IT landscape for us and our customers?

The biggest change that we have seen is Increased Internet Usage.

We have seen a 500 percent increase in NetEqualizer License upgrades over the past 6 months, which means that our customers are ramping up their circuits to ensure a work from home experience without interruption or outages. What we can’t tell for sure is whether or not these upgrades were more out of an abundance of caution, getting ahead of the curve, or if there was actually a significant increase in demand. 

Without a doubt, home usage of Internet has increased, as consumers work from home on Zoom calls, watch more movies, and find ways to entertain themselves in a world where they are staying at home most of the time.  Did this shift actually put more traffic on the average business office network where our bandwidth controllers normally reside?  The knee jerk reaction would be yes of course, but I would argue not so fast.  Let me lay out my logic here…

For one, with a group of people working remotely using the plethora of cloud-hosted collaboration applications such as Zoom, or Blackboard sharing, there is very little if any extra bandwidth burden back at the home office or campus. The additional cloud-based traffic from remote users will be pushed onto their residential ISP providers. On the other hand, organizations that did not transition services to the cloud will have their hands full handling the traffic from home users coming in over VPN into the office.

Higher Education usage is a slightly different animal.   Let’s explore the three different cases as I see them for Higher Education.

#1) Everybody is Remote

In this instance it is highly unlikely there would be any increase in bandwidth usage at the campus itself. All of the Zoom or Microsoft Teams traffic would be shifted to the ISPs at the residences of students and teachers.

2) Teachers are On-Site and Students are Remote

For this we can do an approximation.

For each teacher sharing a room session you can estimate 2 to 8 megabits of consistent bandwidth load. Take a high school with 40 teachers on active Zoom calls, you could estimate a sustained 300 megabits dedicated to Zoom.  With just a skeleton crew of teachers and no students in the building the Internet Capacity should hold as the students tend to eat up huge chunks of bandwidth which is no longer the case. 

3) Mixed Remote and In-person Students

The one scenario that would stress existing infrastructure would be the case where students are on campus while at the same time classes are being broadcast remotely for the students who are unable to come to class in person.  In this instance, you have close to the normal campus load plus all the Zoom or Microsoft Teams sessions emanating from the classrooms. To top it off these Zoom or Microsoft Team sessions are highly sensitive to latency and thus the institution cannot risk even a small amount of congestion as that would cause an interruption to all classes. 

Prior to Covid-19, Internet congestion might interrupt a Skype conference call with the sales team to Europe, which is no laughing matter but a survivable disruption.  Post Covid-19, an interruption in Internet communcation could potentially  interrupt the  entire organization, which is not tolerable. 

In summary, it was probably wise for most institutions to beef up their IT infrastructure to handle more bandwidth. Even knowing in hindsight that  in some cases, it may have not been needed on the campus or the office.  Given the absolutely essential nature that Internet communication has played to keep Businesses and Higher Ed connected, it was not worth the risk of being caught with too little.

Stay tuned for a future article detailing the impact of Covid-19 on ISPs…

Capacity Planning for Cloud Applications


The main factors to consider when capacity planning your Internet Link for cloud applications are:

1) How much bandwidth do your cloud applications actually need?

Typical cloud applications require about 1/2 of a megabit or less. There are exceptions to this rule, but for the most part a good cloud application design does not involve large transfers of data. QuickBooks, salesforce, Gmail, and just about any cloud-based data base will be under the 1/2 megabit guideline. The chart below really brings to light the difference between your typical, interactive Cloud Application and the types of applications that will really eat up your data link.

Screen Shot 2015-12-29 at 4.18.59 PM

Bandwidth Usage for Cloud Based Applications compared to Big Hitters

2) What types of traffic will be sharing your link with the cloud?

The big hitters are typically YouTube and Netflix.  They can consume up to 4 megabits or higher per connection.  Also, system updates for Windows and iOS, as well as internal backups to cloud storage, can consume 20 megabits or more.  Another big hitter can be typical Web Portal sites, such as CNN, Yahoo, and Fox News. A few years ago these sites had a small footprint as they consisted of static images and text.  Today, many of these sites automatically fire up video feeds, which greatly increase their footprint.

3) What is the cost of your Internet Bandwidth, and do you have enough?

Obviously, if there was no limit to the size of your Internet pipe or the required infrastructure to handle it, there would be no concerns or need for capacity planning.  In order to be safe, a good rule of thumb as of 2016 is that you need about 100 megabits per 20 users. Less than that, and you will need to be willing to scale back some of those larger bandwidth-consuming applications, which brings us to point 4.

4) Are you willing to give a lower priority to recreational traffic in order to insure your critical cloud applications do not suffer?

Hopefully you work in an organization where compromise can be explained, and the easiest compromise to make is to limit non-essential video and recreational traffic.  And those iOS updates? Typically a good bandwidth control solution will detect them and slow them down, so essentially they run in the background with a smaller footprint over a longer period of time.

Behind The Scenes, How Many Users Can an Access Point Handle ?


Assume you are teaching a class with thirty students, and every one of them needs help with their homework, what would you do? You’d probably schedule a time slot for each student to come in and talk to you one on one (assuming they all had different problems and there was no overlap in your tutoring).

Fast forward to your wireless access point.  You have perhaps heard all the rhetoric about 3.5 gigaherts, or 5.3 megahertz ?

Unfortunately, the word frequency is tossed around in tech buzzword circles the same way car companies and their marketing arms talk about engine sizes. I have no idea what 2.5 Liter Engine is,  it might sound cool and it might be better than a 2 liter engine, but in reality I don’t know how to compare the two numbers. So to answer our original question, we first need a little background on frequencies to get beyond the marketing speak.

A good example of a frequency, that is also easy to visualize, are ripples on pond. When you drop a rock in the water, ripples propagate out in all directions. Now imagine if  you stood in the water, thigh deep across the pond,  and the ripples hit your leg once each second.  The frequency of the ripples in the water would be 1 hertz, or one peak per second. With access points, there are similar ripples that we call radio waves. Although you can’t see them, like the ripples on the water, they are essentially the same thing. Little peaks and values of electromagnetic waves going up and down and hitting the antenna of the wireless device in your computer or Iphone. So when a marketing person tells you their AP is 2.4 Gigahertz, that means those little ripples coming out of  it are hitting your head, and everything else around them, 2.4 billion times each second. That is quite a few ripples per second.

Now in order to transmit a bit of data, the AP actually stops and starts transmitting ripples. One moment it is sending out 2.4 billion ripples pdf second the next moment it is not.  Now this is where it gets a bit weird, at least for me. The 2.4 billion ripples a second really have no meaning as far as data transmission by themselves; what the AP does is set up a schedule of time slots, let’s say 10 million time slots a second, where it is either transmitting ripples, or it turns the ripple generator off. Everybody that is in communication with the AP is aware of the schedule and all the 10 million time slots.  Think of these time slots as dates on your Calendar, and if you have a sunny day, call that a one, while if you have a cloudy day call that a 0.  Cloudy days are a binary 1 and clear day a binary 0. After we string together 8 days we have a sequence of 1’s and 0’s and a full byte. Now 8 days is a long time to transmit a byte, that is why the AP does not use 24 hours for a time slot, but it could , if we were some laid back hippie society where time did not matter.

So let’s go back over what we have learned and plug in some realistic parameters.
Let’s start with a frequency of 2.4 gigahertz. The fastest an AP can realistically turn this ripple generator off and on is about 1/4 the frequency or about 600 time slots/bits per second. This assumes a perfect world and all the bits get out without any interference from other things generating ripples (like your microwave) or something. So in reality the effective rate might be more on the order of 100 million bits a second.
Now let’s say there are 20 users in the room, sharing the available bits equally. They would all be able to run 5 megabits each. But again, there is over head switching between these users (sometimes they talk at the same time and have to constantly back off and re-synch)  Realistically with 20 users all competing for talk time,  1 to 2 megabits per user is more likely.

Other factors that can affect the number of users.
As you can imagine the radio AP manufacturers do all sorts of things to get better numbers. The latest AP’s have multiple antennas and run in two frequencies (two ripple generators) for more bits.

There are also often interference problems with multiple AP’s in the area , all making ripples . The transmission of  ripples for one AP do not stop at a fixed boundary, and this complexity will cause the data rates to slow down while the AP’s sort themselves out.

For related readings on Users and Access Points:

How Many Users Can a Wireless Access Point Handle?

How to Build Your Own Linux Access Points

How to use Access Points to set up and In-Home Music System

Five Things to Consider When Building a Commercial Wireless Network


By Art Reisman, CTO, APconnections,  www.netequalizer.com

with help from Sam Beskur, CTO Global Gossip North America, http://hsia.globalgossip.com/

Over the past several years we have provided our Bandwidth Controllers as a key component in many wireless networks.  Along the way we have seen many successes, and some not so successful deployments.  What follows are some key learnings  from our experiences with wireless deployment,

1) Commercial Grade Access Points versus Consumer Grade

Commercial grade access points use intelligent collision avoidance in densely packed areas. Basically, what this means is that they make sure that a user with access to multiple access points is only being serviced by one AP at a time. Without this intelligence, you get signal interference and confusion. An analogy would be if  you asked a sales rep for help in a store, and two sales reps start talking back to you at the same time; it would be confusing as to which one to listen to. Commercial grade access points follow a courtesy protocol, so you do not get two responses, or possibly even 3, in a densely packed network.

Consumer grade access points are meant to service a single household.  If there are two in close proximity to each other, they do not communicate. The end result is interference during busy times, as they will both respond at the same time to the same user without any awareness.  Due to this, users will have trouble staying connected. Sometimes the performance problems show up long after the installation. When pricing out a solution for a building or hotel be sure and ask the contractor if they are bidding in commercial grade (intelligent) access points.

2) Antenna Quality

There are a limited number of frequencies (channels) open to public WiFi.  If you can make sure the transmission is broadcast in a limited direction, this allows for more simultaneous conversations, and thus better quality.  Higher quality access points can actually figure out the direction of the users connected to them, such that, when they broadcast they cancel out the signal going out in directions not intended for the end-user.  In tight spaces with multiple access points, signal canceling antennas will greatly improve service for all users.

3) Installation Sophistication and Site Surveys

When installing a wireless network, there are many things a good installer must account for. For example,  the attenuation between access points.  In a perfect world  you want your access points to be far enough apart so they are not getting blasted by their neighbor’s signal. It is okay to hear your neighbor in the background a little bit, you must have some overlap otherwise you would have gaps in coverage,  but you do not want them competing with high energy signals close together.   If you were installing your network in a giant farm field with no objects in between access points, you could just set them up in a grid with the prescribed distance between nodes. In the real world you have walls, trees, windows, and all sorts of objects in and around buildings. A good installer will actually go out and measure the signal loss from these objects in order to place the correct number of access points. This is not a trivial task, but without an extensive site survey the resultant network will have quality problems.

4) Know What is Possible

Despite all the advances in wireless networks, they still have density limitations. I am not quite sure how to quantify this statement other than to say that wireless does not do well in an extremely crowded space (stadium, concert venue, etc.) with many devices all trying to get access at the same time. It is a big jump from designing coverage for a hotel with 1,000 guests spread out over the hotel grounds, to a packed stadium of people sitting shoulder to shoulder. The other compounding issue with density is that it is almost impossible to simulate before building out the network and going live.  I did find a reference to a company that claims to have done a successful build out in Gillette Stadium, home of the New England Patriots.  It might be worth looking into this further for other large venues.

5) Old Devices

Old 802.11b devices on your network will actually cause your access points to back off to slower speeds. Most exclusively-b devices were discontinued in the mid 2000’s, but they are still around. The best practice here is to just block these devices, as they are rare and not worth bringing the speed of your overall network down.

We hope these five (5) practical tips help you to build out a solid commercial wireless network. If you have questions, feel free to contact APconnections or Global Gossip to discuss.

Related Article:  Wireless Site Survey With Free tools

Wireless is Nice, but Wired Networks are Here to Stay


By Art Reisman, CTO, www.netequalizer.com

Art Reisman CTO www.netequalizer.com

The trend to go all wireless in high density housing was seemingly a slam dunk just a few years ago. The driving forces behind the exclusive deployment of wireless over wired access was two fold.

  • Wireless cost savings. It is much less expensive to strafe a building with a mesh network  rather than to pay a contractor to insert RJ45 cable throughout the building.
  • People expect wireless. Nobody plugs a computer into the wall anymore – or do they?

Something happened on the way to wireless Shangri-La. The physical limitations of wireless, combined with the appetite for ever increasing video, have caused some high density housing operators to rethink their positions.

In a recent discussion with several IT administrators representing large residential housing units, the topic turned to whether or not the wave of the future would continue to include wired Internet connections. I was surprised to learn that the consensus was that wired connections were not going away anytime soon.

To quote one attendee…

“Our parent company tried cutting costs by going all wireless in one of our new builds. The wireless access in buildings just can’t come close to achieving the speeds we can get in the wired buildings. When push comes to shove, our tenants still need to plug into the RJ45 connector in the wall socket. We have plenty of bandwidth at the core , but the wireless just does can’t compete with the expectations we have attained with our wired connections.”

I found this statement on a Resnet Mailing list from Brown University.

“Greetings,

     I just wanted to weigh-in on this idea. I know that a lot of folks seem to be of the impression that ‘wireless is all we need’, but I regularly have to connect physically to get reasonable latency and throughput. From a bandwidth perspective, switching to wireless-only is basically the same as replacing switches with half-duplex hubs.
     Sure, wireless is convenient, and it’s great for casual email/browsing/remote access users (including, unfortunately, the managers who tend to make these decisions). Those of us who need to move chunks of data around or who rely on low-latency responsiveness find themselves marginalized in wireless-only settings. For instance: RDP, SSH, and X11 over even moderately busy wireless connections are often barely usable, and waiting an hour for a 600MB Debian ISO seems very… 1997.”

Despite the tremendous economic pressure to build ever faster wireless networks, the physics of transmitting signals through the air will ultimately limit the speed of wireless connections far below of what can be attained by wired connections. I always knew this, but was not sure how long it would take reality to catch up with hype.

Why is wireless inferior to wired connections when it comes to throughput?

In the real world of wireless, the factors that limit speed include

  1. The maximum amount of data that can be transmitted on a wireless channel is less than wired. A rule of thumb for transmitting digital data over the airwaves is that you can only send bits of  data at 1/2 the frequency. For example, 800 megahertz ( a common wireless carrier frequency) has  800 million cycles per second and 1/2 of that is 400 million cycles per second. This translates to a theoretical maximum data rate of 400 megabits. Realistically though, with imperfect signals (noise) and other environmental factors, 1/10 of the original frequency is more likely the upper limit. This gives us a maximum carrying capacity per channel of 80 megabits on our 800 megahertz channel. For contrast, the upper limit of a single fiber cable is around 10 gigabits, and higher speeds are attained by laying cables in parallel, bonding multiple wires together in one cable, and on major back bones, providers can transmit multiple frequencies of light down the same fiber achieving speeds of 100 gigabits on a single fiber! In fairness, wireless signals can also use multiple frequencies for multiple carrier signals, but the difference is you cannot have them in close proximity to each other.
  2. The number of users sharing the channel is another limiting factor. Unlike a single wired connection, wireless users in densely populated areas must share a frequency, you cannot pick out a user in the crowd and dedicate the channel for a single person.  This means, unlike the dedicated wire going straight from your Internet provider to your home or office, you must wait your turn to talk on the frequency when there are other users in your vicinity. So if we take our 80 megabits of effective channel bandwidth on our 800 megahertz frequency, and add in 20 users, we are no down to 4 megabits per user.
  3. The efficiency of the channel. When multiple people are sharing a channel, the efficiency of how they use the channel drops. Think of traffic at a 4-way stop. There is quite a bit of wasted time while drivers try to figure out whose turn it is to go, not to mention they take a while to clear the intersection. Same goes for wireless users sharing techniques there is always overhead in context switching between users. Thus we can take our 20 user scenario down to an effective data rate of 2 megabits
  4. Noise.  There is noise and then there is NOISE. Although we accounted for average noise in our original assumptions, in reality there will always be segments of the network that experience higher noise levels than average. When NOISE spikes there is further degradation of the network, and sometimes a user cannot communicate at all with an AP. NOISE is a maddening and unquantifiable variable. Our assumptions above were based on the degradation from “average noise levels”, it is not unheard of for an AP to drop its effective transmit rate by 4 or 5 times to account for noise, and thus an effective data rate for all users on that segment from our original example drops down to 500kbs, just barely enough bandwidth to watch a bad video.

Long live wired connections!

Are You Unknowingly Sharing Bandwidth with Your Neighbors?


Editor’s Note: The following is a revised and update version of our original article from April 2007.

In a recent article titled, “The White Lies ISPs Tell about Broadband Speeds,” we discussed some of the methods ISPs use when overselling their bandwidth in order to put on their best face for their customers. To recap a bit, oversold bandwidth is a condition that occurs when an ISP promises more bandwidth to its users than it can actually deliver hence, during peak hours you may actually be competing with your neighbor for bandwidth. Since the act of “overselling” is a relative term, with some ISPs pushing the limit to greater extremes than others, we thought it a good idea to do a quick follow-up and define some parameters for measuring the oversold condition.

For this purpose we use the term contention ratio. A contention ratio is simply the size of an Internet trunk divided by the number of users. We normally think of Internet trunks in units of megabits. For example, 10 users sharing a one megabit trunk would have a 10-to-1 contention ratio. If sharing the bandwidth on the trunk equally and simultaneously, each user could sustain a constant feed of 100kbs, which is exactly 1/10 of the overall bandwidth.

So what is an acceptable contention ratio?

From a business standpoint, it is whatever a customer will put up with and pay for without canceling their service. This definition may seem ethically suspect, but whether in the bygone days of telecommunications phone service or contemporary Internet bandwidth business, there are long-standing precedents for overselling. What do you think a circuit busy signal is caused by? Or a dropped cell phone call? It’s best to leave the moral debate to a university assignment or a Sunday sermon.

So, without pulling any punches, what exactly will a customer tolerate before pulling the plug?
Here are some basic unofficial observations:
  • Rural customers in the US and Canada: Contention ratios of 10 to 1 are common (2007 this was 20 to 1)
  • International customers in remote areas of the world: Contention ratios of 20 to 1 are common (2007 was 80 to 1)
  • Internet providers in urban areas: Contention ratios of 5 to 1 are to be expected (2007 this was 10 to 1) *

* Larger cable operators have extremely fast last mile connections, most of their speed claims are based on the speed of their last mile connection and not their Internet Exchange point thresholds. The numbers cited are related to their connection to the broader Internet and not the last mile from their office (NOC) to your home. Admittedly, the lines of what is the Internet can be blurred as many cable operators cache popular local content (NetFlix Movies, for example). The movie is delivered from a server at their local office direct to your home, hence technically we would not consider this related to your contention ratio to the Internet.

The numbers above are a good, rough starting point, but things are not as simple as they look. There is a statistical twist as bandwidth amounts get higher.

From the customers perspective of speed, contention ratios can actually increase as the overall Internet trunk size gets larger. For example, if 50 people can share one megabit without mutiny, it should follow that 100 people can share two megabits without mutiny as the ratio has not changed. It is still 50 to 1.

However, from observations of hundreds of ISPs, we can easily conclude that perhaps 110 people can share two megabits with the same tolerance as 50 people sharing one megabit. What this means is that the larger the ISP, the more bandwidth at a fixed cost per megabit, and thus the larger the contention ratios you can get away with.

Is this really true? And if so, what are its implications for your business?

This is simply an empirical observation, backed up by talking to literally thousands of ISPs over the course of four years and noticing how their over subscription ratios increase with the size of their trunk while customer perception of speed remains about the same.

A conservative estimate is that, starting with the baseline ratio listed above, you can safely add 10 percent more subscribers above and beyond the original contention ratio for each megabit of trunk they share.

Related Articles

How to speed up access on your iPhone

How to determine the true speed of video over your Internet Connection

Case Study: A Simple Solution to Relieve Congestion on Your MPLS Network


Summary: In the last few months, we have set up several NetEqualizer systems on hub and spoke MPLS networks. Our solution is very cost effective because it differs from many TOS/Compression-based WAN optimization products that require multiple pieces of hardware.  Normally, for WAN optimization, a device is placed at the HUB and a partner device is placed at each remote location. With the NetEqualizer technology, we have been able to simply and elegantly solve contention issues with a single device at the central hub.

The problem:

A customer has a hub and spoke MPLS network where remote sites get their public Internet and corporate data by coming in on a spoke to a central site.  Although the network at the host site has plenty of bandwidth, the spokes have a fixed allocation over the MPLS and are experiencing contention issues (e.g. slow response times to corporate sales data, etc.).

The solution:

By placing a NetEqualizer at a central location, so that all the remote spokes come in through the NetEqualizer, we are able to sense when a remote spoke has reached its contention level. We then perform prioritization on all the competing applications and user streams coming in over the congested link.

Why it works:

QoS and priority is really quite simple: it is always the case where some large selfish application is dominating a shared link. The NetEqualizer is able to spot these selfish applications and scale them back using a technique called Equalizing. QoS and priority are just a matter of taking away bandwidth from somebody else. See our related article: QOS is a matter of sacrifice.

Okay, but how does it really work?

How does NetEqualizer solve the congested MPLS link issue?

The NetEqualizer solution, which is completely compatible with MPLS, works by taking advantage of the natural inclination of applications to back off when artificially restrained. We’ll get back to this key point in a moment.

NetEqualizer will adjust selfish application streams by adding latency, forcing them to back off and allow potentially starved data applications to establish communications – thus eliminating any disruption.

Once you have determined the peak capacity of an MPLS spoke (if you don’t know for sure it can be determined empirically through busy hour observation), you then tell the centralized NetEqualizer the throughput of the spoke through its defined subnet range or VLAN identification tag. This tells the NetEqualizer to kick into gear when that upper limit on the spoke is reached.

Once configured, the NetEqualizer constantly (every second) measures the total aggregate bandwidth throughput traversing every spoke on your network. If it senses the upper limit is being reached, NetEqualizer will then isolate the dominating flows and encourage them to back off.

Each connection between a user on your network and the Internet constitutes a traffic flow. Flows vary widely from short dynamic bursts, which occur, for example, when searching a small Web site, to large persistent flows, as when performing peer-to-peer file sharing or downloading a large file.

By keeping track of every flow going through each MPLS spoke, the NetEqualizer can make a determination of which ones are getting an unequal share of bandwidth and thus crowding out flows from weaker applications.

NetEqualizer determines detrimental flows from normal ones by taking the following questions into consideration:

  1. How persistent is the flow?
  2. How many active flows are there?
  3. How long has the flow been active?
  4. How much total congestion is currently on the link?
  5. How much bandwidth is the flow using relative to the link size?

Once the answers to these questions are known, NetEqualizer will adjust offending flows by adding latency, forcing them to back off and allow potentially starved applications to establish communications – thus eliminating any disruption. Selfish Applications with more aggressive bandwidth needs will be throttled back during peak contention. This is done automatically by the NetEqualizer, without requiring any additional programming by administrators.

The key to making this happen over an MPLS link relies on the fact that if you slow a down a selfish application it will back off. This can be done via the NetEqualizer without any changes to the topology of your MPLS network, since the throttling is done independent of the network.

Questions and Answers

How do you know congestion is caused by a heavy stream?

We have years of experience optimizing networks with this technology. It is safe to say that on any congested network, roughly five percent of users are responsible for 80 percent of Internet traffic. This seems to be a law of Internet usage.2

Can certain applications be given priority?

NetEqualizer can give priority by IP address, for video streams, and in its default mode it naturally gives priority to VoIP, thus addressing a common need for commercial operators.

———————————————————————————————————————————————–

2Randy Barrett, “Putting the Squeeze on Internet Hogs: How Operators Deal with Their Greediest Users.” Multichannel News. 7 Mar. 2007. Retrieved 1 Aug. 2007 http://www.multichannel.com/article/CA6439454.html

Update: Bandwidth Consumption and the IT Professionals that are Tasked to Preserve It


“What is the Great Bandwidth Arms Race? Simply put, it is the sole reason my colleague gets up and goes to work each day. It is perhaps the single most important aspect of his job—the one issue that is always on his mind, from the moment he pulls into the campus parking lot in the morning to the moment he pulls into his driveway at home at night. In an odd way, the Great Bandwidth Arms Race is the exact opposite of the “Prime Directive” from Star Trek: rather than a mandate of noninterference, it is one of complete and intentional interference. In short, my colleague’s job is to effectively manage bandwidth consumption at our university. He is a technological gladiator, and the Great Bandwidth Arms Race is his arena, his coliseum in which he regularly battles conspicuous bandwidth consumption.”

The excerpt above is from an article written by Paul Cesarini, a Professor at Bowling Green University back 2007. It would be interesting to get some comments and updates from Paul at some point, but for now, I’ll provide an update from the vendor perspective.

Since 2007, we have seen a big drop in P2P traffic that formerly dominated most networks. A report from bandwidth control vendor Sandvine tends to agree with our observations.

Sandvine Report
— The growth of Netflix, the decline of P2P traffic, and the end of the PC era are three notable aspects of a new report by network equipment company Sandvine. Netflix accounted for 27.6% of downstream U.S. Internet traffic in the third quarter, according to Sandvine’s “Global Internet Phenomena Report” for Fall 2011. YouTube accounted for 10 percent of downstream traffic and BitTorrent, the file-sharing protocol, accounted for 9 percent.”

We also agree with Sandvine’s current findings that video is driving bandwidth consumption; however, for the network professionals entrenched in the battle of bandwidth consumption, there is another factor at play which may indicate some hope on the horizon.

There has been a precipitous drop on raw bandwidth costs over the past 10 years. Commercial bandwidth rates have dropped from around $100 or more per megabit to as little as $10 per megabit. So the question now is: Will the availability of lower-cost bandwidth catch up to the demand curve? In other words, will the tools and human effort put into the fight against managing bandwidth become moot? And if so, what is the time frame?

I am going to go out halfway on limb and claim we are seeing bandwidth catch up with demand and hence the battle for the IT professional is going to subside over the coming years.

The reason for my statement is that once we get to a price point where most consumers can truly send and receive interactive video (note this is the not the same as ISPs using caching tricks), we will see some of the pressure spent on micro-managing bandwidth consumption with human labor ease up. Yes, there will be consumers that want HD video all the time, but with a few rules in your bandwidth control device you will be able allow certain levels of bandwidth consumption through, including low resolution video for Skype and YouTube, without crashing your network. Once we are at this point, the pressure for making trade-offs on specific kinds of consumption will ease off a bit.  What this implies is that the cost of human labor to balance bandwidth needs will be relegated to dumb devices and perhaps obsolete this one aspect of the job for an IT professional.

Our Take on Network Instruments 5th Annual Network Global Study


Editors Note: Network Instruments released their “Fifth Annual State of the Network Global study” on March 13th, 2o12. You can read their full study here. Their results were based on responses by 163 network engineers, IT directors, and CIOs in North America, Asia, Europe, Africa, Australia, and South America. Responses were collected from October 22, 2011 to January 3, 2012.

What follows is our take (or my .02 cents) on the key findings around Bandwidth Management and Bandwidth Monitoring from the study.

Finding #1: Over the next two years, more than one-third of respondents expect bandwidth consumption to increase by more than 50%.

Part of me says “well, duh!” but that is only because we hear that from many of our customers. So I guess if you were an Executive, far removed from the day-to-day, this would be an important thing to have pointed out to you. Basically, this is your wake up call (if you are not already awake) to listen to your Network Admins who keep asking you to allocate funds to the network. Now is the time to make your case for more bandwidth to your CEO/President/head guru. Get together budget and resources to build out your network in anticipation of this growth – so that you are not caught off guard. Because if you don’t, someone else will do it for you.

Finding #2: 41% stated network and application delay issues took more than an hour to resolve.

You can and should certainly put monitoring on your network to be able to see and react to delays. However, another way to look at this, admittedly biased from my bandwidth shaping background, is get rid of the delays!

If you are still running an unshaped network, you are missing out on maximizing your existing resource. Think about how smoothly traffic flows on roads, because there are smoothing algorithms (traffic lights) and rules (speed limits) that dictate how traffic moves, hence “traffic shaping.” Now, imagine driving on roads without any shaping in place. What would you do when you got to a 4-way intersection? Whether you just hit the accelerator to speed through, or decided to stop and check out the other traffic probably depends on your risk-tolerance and aggression profile. And the result would be that you make it through OK (live) or get into an ugly crash (and possibly die).

Similarly, your network traffic, when unshaped, can live (getting through without delays) or die (getting stuck waiting in a queue) trying to get to its destination. Whether you look at deep packet inspection, rate limiting, equalizing, or a home-grown solution, you should definitely look into bandwidth shaping. Find a solution that makes sense to you, will solve your network delay issues, and gives you a good return-on-investment (ROI). That way, your Network Admins can spend less time trying to find out the source of the delay.

Finding #3: Video must be dealt with.

24% believe video traffic will consume more than half of all bandwidth in 12 months.
47% say implementing and measuring QoS for video is difficult.
49% have trouble allocating and monitoring bandwidth for video.

Again, no surprise if you have been anywhere near a network in the last 2 years. YouTube use has exploded and become the norm on both consumer and business networks. Add that to the use of video conferencing in the workplace to replace travel, and Netflix or Hulu to watch movies and TV, and you can see that video demand (and consumption) has risen sharply.

Unfortunately, there is no quick, easy fix to make sure that video runs smoothly on your network. However, a combination of solutions can help you to make video run better.

1) Get more bandwidth.

This is just a basic fact-of-life. If you are running a network of < 10Mbps, you are going to have trouble with video, unless you only have one (1) user on your network. You need to look at your contention ratio and size your network appropriately.

2) Cache static video content.

Caching is a good start, especially for static content such as YouTube videos. One caveat to this, do not expect caching to solve network congestion problems (read more about that here) – as users will quickly consume any bandwidth that caching has freed up. Caching will help when a video has gone viral, and everyone is accessing it repeatedly on your network.

3) Use bandwidth shaping to prioritize business-critical video streams (servers).

If you have a designated video-streaming server, you can define rules in your bandwidth shaper to prioritize this server. The risk of this strategy is that you could end up giving all your bandwidth to video; you can reduce the risk by rate capping the bandwidth portioned out to video.

As I said, this is just my take on the findings. What do you see? Do you have a different take? Let us know!

You May Be the Victim of Internet Congestion


Have you ever had a mysterious medical malady? The kind where maybe you have strange spots on your tongue, pain in your left temple, or hallucinations of hermit crabs at inappropriate times – symptoms seemingly unknown to mankind?

But then, all of a sudden, you miraculously find an exact on-line medical diagnosis?

Well, we can’t help you with medical issues, but we can provide a similar oasis for diagnosing the cause of your slow network – and even better, give you something proactive to do about it.

Spotting classic congested network symptoms:

You are working from your hotel room late one night, and you notice it takes a long time to get connected. You manage to fire off a couple emails, and then log in to your banking website to pay some bills. You get the log-in prompt, hit return, and it just cranks for 30 seconds, until… “Page not found.” Well maybe the bank site is experiencing problems?

You decide to get caught up on Christmas shopping. Initially the Macy’s site is a bit a slow to come up, but nothing too out of the ordinary on a public connection. Your Internet connection seems stable, and you are able to browse through a few screens and pick out that shaving cream set you have been craving – shopping for yourself is more fun anyway. You proceed to checkout, enter in your payment information, hit submit, and once again the screen locks up. The payment verification page times out. You have already entered your credit card, and with no confirmation screen, you have no idea if your order was processed.

We call this scenario, “the cyclical rolling brown out,” and it is almost always a problem with your local Internet link having too many users at peak times. When the pressure on the link from all active users builds to capacity, it tends to spiral into a complete block of all access for 20 to 30 seconds, and then, service returns to normal for a short period of time – perhaps another 30 seconds to 1 minute. Like a bad case of Malaria, the respites are only temporary, making the symptoms all the more insidious.

What causes cyclical loss of Internet service?

When a shared link in something like a hotel, residential neighborhood, or library reaches capacity, there is a crescendo of compound gridlock. For example, when a web page times out the first time, your browser starts sending retries. Multiply this by all the users sharing the link, and nobody can complete their request. Think of it like an intersection where every car tries to proceed at the same time, they crash in the middle and nobody gets through. Additional cars keep coming and continue to pile on. Eventually the police come with wreckers and clear everything out of the way. On the Internet, eventually the browsers and users back off and quit trying – for a few minutes at least. Until late at night when the users finally give up, the gridlock is likely to build and repeat.

What can be done about gridlock on an Internet link?

The easiest way to prevent congestion is to purchase more bandwidth. However, sometimes even with more bandwidth, the congestion might overtake the link. Eventually most providers also put in some form of bandwidth control – like a NetEqualizer. The ideal solution is this layered approach – purchasing the right amount of bandwidth AND having arbitration in place. This creates a scenario where instead of having a busy four-way intersection with narrow streets and no stop signs, you now have an intersection with wider streets and traffic lights. The latter is more reliable and has improved quality of travel for everyone.

For some more ideas on controlling this issue, you can reference our previous article, Five Tips to Manage Internet Congestion.

The 10-Gigabit Barrier for Bandwidth Controllers and Intel-Based Routers


By Art Reisman

Editor’s note: This article was adapted from our answer to a NetEqualizer pre-sale question asked by an ISP that was concerned with its upgrade path. We realized the answer was useful in a broader sense and decided to post it here.

Any router, bandwidth controller, or firewall that is based on Intel architecture and buses will never be able to go faster than about about 7 gigabits sustained. (This includes our NE4000 bandwidth controller. While the NE4000 can actually reach speeds close to 10 gigabits, we rate our equipment for five gigabits because we don’t like quoting best-case numbers to our customers.) The limiting factor in Intel architecture is that to expand beyond 10-gigabit speeds you cannot be running with a central clock. Therefore, with a central clock controlling the show, it is practically impossible to move data around much faster than 10 gigabits.

The alternative is to use a specialized asynchronous design, which is what faster switches and hardware do. They have no clock or centralized multiprocessor/bus. However, the price point for such hardware quickly jumps to 5-10 times the Intel architecture because it must be custom designed. It is also quite limited in function once released.

Obviously, vendors can stack a bunch of 10-gig fiber bandwidth controllers behind a switch and call it something faster, but this is no different from dividing up your network paths and using multiple bandwidth controllers yourself.  So, be careful when assessing the claims of other manufacturers in this space.

Considering these limitations, many cable operators here in the US have embraced the 10-gigabit barrier. At some point you must divide and conquer using multiple 10-gig fiber links and multiple NE4000 type boxes, which we believe is really the only viable plan — that is if you want any sort of sophistication in your bandwidth controller.

While there are some that will keep requesting giant centralized boxes, and paying a premium for them (it’s in their blood to think single box, central location), when you think about the Internet, it only works because it is made of many independent paths. There is no centralized location by design. However, as you approach 10-gigabit speeds in your organization, it might be time to stop thinking “single box.”

I went through this same learning curve as a system architect at AT&T Bell Labs back in the 1990s.  The sales team was constantly worried about how many telephone ports we could support in one box because that is what operators were asking for.  It shot the price per port through the roof with some of our designs. So, in our present case, we (NetEqualizer) decided not to get into that game because we believe that price per megabit of shaping will likely win out in the end.

Art Reisman is currently CTO and co-founder of APconnections, creator of the NetEqualizer. He  has worked at several start-up companies over the years and has invented and brought several technology products to market, both on his own and with the backing of larger corporations. This includes tools for the automotive industry.

Five Tips to Manage Network Congestion


As the demand for Internet access continues to grow around the world, the complexity of planning, setting up, and administering your network grows. Here are five (5) tips that we have compiled, based on discussions with network administrators in the field.

#1) Be Smart About Buying Bandwidth
The local T1 provider does not always give you the lowest price bandwidth.  There are many Tier 1 providers out there that may have fiber within line-of-sight of your business. For example, Level 3 has fiber rings already hot in many metro areas and will be happy to sell you bandwidth. To get a low-cost high-speed link to your point of presence, numerous companies can set up your wireless network infrastructure.

#2) Manage Expectations
You know the old saying “under promise and over deliver”.  This holds true for network offerings.  When building out your network infrastructure, don’t let your network users just run wide open. As you add bandwidth, you need to think about and implement appropriate rate limits/caps for your network users.  Do not wait; the problem with waiting is that your original users will become accustomed to higher speeds and will not be happy with sharing as network use grows – unless you enforce some reasonable restrictions up front.  We also recommend that you write up an expectations document for your end users “what to expect from the network” and post it on your website for them to reference.

#3) Understand Your Risk Factors
Many network administrators believe that if they set maximum rate caps/limits for their network users, then the network is safe from locking up due to congestion. However, this is not the case.  You also need to monitor your contention ratio closely.  If your network contention ratio becomes unreasonable, your users will experience congestion aka “lock ups” and “freeze”. Don’t make this mistake.

This may sound obvious, but let me spell it out. We often run into networks with 500 network users sharing a 20-meg link. The network administrator puts in place two rate caps, depending on the priority of the user  — 1 meg up and down for user group A and 5 megs up and down for user group B.  Next, they put rate caps on each group to ensure that they don’t exceed their allotted amount. Somehow, this is supposed to exonerate the network from experiencing contention/congestion. This is all well and good, but if you do the math, 500 network users on a 20 meg link will overwhelm the network at some point, and nobody will then be able to get anywhere close to their “promised amount.”

If you have a high contention ratio on your network, you will need something more than rate limits to prevent lockups and congestion. At some point, you will need to go with a layer-7 application shaper (such as Blue Coat Packeteer or Allot NetEnforcer), or go with behavior-based shaping (NetEqualizer). Your only other option is to keep adding bandwidth.

#4) Decide Where You Want to Spend Your Time
When you are building out your network, think about what skill sets you have in-house and those that you will need to outsource.  If you can select network applications and appliances that minimize time needed for set-up, maintenance, and day-to-day operations, you will reduce your ongoing costs. This is true whether your insource or outsource, as there is an “opportunity cost” for spending time with each network toolset.

#5) Use What You Have Wisely
Optimize your existing bandwidth.   Bandwidth shaping appliances can help you to optimize your use of the network.   Bandwidth shapers work in different ways to achieve this.  Layer-7 shapers will allocate portions of your network to pre-defined application types, splitting your pipe into virtual pipes based on how you want to allocate your network traffic.  Behavior-based shaping, on the other hand, will not require predefined allocations, but will shape traffic based on the nature of the traffic itself (latency-sensitive, short/bursty traffic is prioritized higher than hoglike traffic).   For known traffic patterns on a WAN, Layer-7 shaping can work very well.  For unknown patterns like Internet traffic, behavior-based shaping is superior, in our opinion.

On Internet links, a NetEqualizer bandwidth shaper will allow you to increase your customer base by between 10 to 30 percent without having to purchase additional bandwidth. This allows you to increase the amount of people you can put into your infrastructure without an expensive build out.

In order to determine whether the return-on-investment (ROI) makes sense in your environment, use our ROI tool to calculate your payback period on adding bandwidth control to your network.  You can then compare this one-time cost with your expected recurring month costs of additional bandwidth.  Also note in many cases you will need to do both at some point.  Bandwidth shaping can delay or defer purchasing additional bandwidth, but with growth in your network user base, you will eventually need to consider purchasing more bandwidth.

In Summary…
Obviously, these five tips are not rocket science, and some of them you may be using already.  We offer them here as a quick guide & reminder to help in your network planning.  While the sea change that we are all seeing in internet usage (more on that later…) makes network administration more challenging every day, adequate planning can help to prepare your network for the future.

Created by APconnections, the NetEqualizer is a plug-and-play bandwidth control and WAN/Internet optimization appliance that is flexible and scalable. When the network is congested, NetEqualizer’s unique “behavior shaping” technology dynamically and automatically gives priority to latency sensitive applications, such as VoIP and email. Click here to request a full price list.

Network Capacity Planning: Is Your Network Positioned for Growth?


Authored by:  Sandy McGregor, Director of Sales & Marketing for APConnections, Inc.
Sandy has a Masters in Management Information Systems and over 17 years experience in the Applications Development Life Cycle.  In the past, she has been a Project Manager for large-scale data center projects, as well as a Director heading up architecture, development and operations teams.  In Sandy’s current role at APConnections, she is responsible for tracking industry trends.

As you may have guessed, mobile users are gobbling up network bandwidth in 2010!  Based on research conducted in the first half of 2010, Allot Communications has released The Allot MobileTrends Report , H1 2010 showing dramatic growth in mobile data bandwidth usage in 2010- up 68% in Q1 and Q2.

I am sure that you are seeing the impacts of all this usage on your networks.  The good news is all this usage is good for your business, as a network provider,  if you are positioned to grow to meet the needs of all this growth!  Whether you sell network usage to customers (as a ISP or WISP) or “sell” it internally (colleges and corporations), growth means that the infrastructure you provide becomes more and more critical to your business.

Here are some areas that we found of particular interest in the article, and their implications on your network, from our perspective…

1) Video Streaming grew by 92% to 35% of mobile use

It should be no surprise that video steaming applications take up a 35% share of mobile bandwidth, and grew by 92%.  At this growth rate, which we believe will continue and grow even faster in the future, your network capacity will need to grow as well.  Luckily, bandwidth prices are continuing to come down in all geographies.

No matter how much you partition your network using a bandwidth shaping strategy, the fact is that video streaming takes up a lot of bandwidth.  Add to that the fact that more and more users are using video, and you have a full pipe before you know it!  While you can look at ways to cache video, we believe that you have no choice but to add bandwidth to your network.

2) Users are downloading like crazy!

When your customers are not watching videos, they are downloading, either via P2P or HTTP, which combined represented 31 percent of mobile bandwidth, with an aggregate growth rate of 80 percent.  Although additional network capacity can help somewhat here, large downloads or multiple P2P users can still quickly clog your network.

You need to first determine if you want to allow P2P traffic on your network.  If you decide to support P2P usage, you may want to think how you will identify which users are doing P2P and if you will charge a premium for this service. Also, be aware that encrypted P2P traffic is on the rise, which makes it difficult to figure out what traffic is truly P2P.

Large file downloads need to be supported.  Your goal here should be to figure out how to enable downloading for your customers without slowing down other users and bringing the rest of your network to a halt.

In our opinion, P2P and downloading is an area where you should look at bandwidth shaping solutions.  These technologies use various methods to prioritize and control traffic, such as application shaping (Allot, BlueCoat, Cymphonix) or behavior-based shaping (NetEqualizer).

These tools, or various routers (such as Mikrotik), should also enable you to set rate limits on your user base, so that no one user can take up too much of your network capacity.  Ideally, rate limits should be flexible, so that you can set a fixed amount by user, group of users (subnet, VLAN), or share a fixed amount across user groups.

3) VoIP and IM are really popular too

The second fastest growing traffic types were VoIP and Instant Messaging (IM).  Note that if your customers are not yet using VoIP, they will be soon.  The cost model for VoIP just makes it so compelling for many users, and having one set of wires if an office configuration is attractive as well (who likes the tangle of wires dangling from their desk anyways?).

We believe that your network needs to be able to handle VoIP without call break-up or delay.  For a latency-sensitive application like VoIP, bandwidth shaping (aka traffic control, aka bandwidth management) is key.  Regardless of your network capacity, if your VoIP traffic is not given priority, call break up will occur.  We believe that this is another area where bandwidth shaping solutions can help you.

IM on the other hand, can handle a little latency (depending on how fast your customers type & send messages).  To a point, customers will tolerate a delay in IM – but probably 1-2 seconds max.  After that,they will blame your network, and if delays persist, will look to move to another network provider.

In summary, to position your network for growth:

1) Buy More Bandwidth – It is a never-ending cycle, but at least the cost of bandwidth is coming down!

2) Implement Rate Limits – Stop any one user from taking up your whole network.

3) Add Bandwidth Shaping – Maximize what you already have.  Think efficiency here.  To determine the payback period on an investment in the NetEqualizer, try our new ROI tool.  You can put together similar calculations for other vendors.

Note:  The Allot MobileTrends Report data was collected from Jan. 1 to June 30 from leading mobile operators worldwide with a combined user base of 190 million subscribers.

NetEqualizer Field Guide to Network Capacity Planning


I recently reviewed an article that covered bandwidth allocations for various Internet applications. Although the information was accurate, it was very high level and did not cover the many variances that affect bandwidth consumption. Below, I’ll break many of these variances down, discussing not only how much bandwidth different applications consume, but the ranges of bandwidth consumption, including ping times and gaming, as well as how our own network optimization technology measures bandwidth consumption.

E-mail

Some bandwidth planning guides make simple assumptions and provide a single number for E-mail capacity planning, oftentimes overstating the average consumption. However, this usually doesn’t provide an accurate assessment. Let’s consider a couple of different types of E-mail.

E-mail — Text

Most E-mail text messages are at most a paragraph or two of text. On the scale of bandwidth consumption, this is negligible.

However, it is important to note that when we talk about the bandwidth consumption of different kinds of applications, there is an element of time to consider — How long will this application be running for? So, for example, you might send two kilobytes of E-mail over a link and it may roll out at the rate of one megabit. A 300-word, text-only E-mail can and will consume one megabit of bandwidth. The catch is that it generally lasts just a fraction of second at this rate. So, how would you capacity plan for heavy sustained E-mail usage on your network?

When computing bandwidth rates for classification with a commercial bandwidth controller such as a NetEqualizer, the industry practice is to average the bandwidth consumption for several seconds, and then calculate the rate in units of kilobytes per second (Kbs).

For example, when a two kilobyte file (a very small E-mail, for example) is sent over a link for a fraction of a second, you could say that this E-mail consumed two megabits of bandwidth. For the capacity planner, this would be a little misleading since the duration of the transaction was so short. If you take this transaction average over a couple of seconds, the transfer rate would be just one kbs, which for practical purposes, is equivalent to zero.

E-mail with Picture Attachments

A normal text E-mail of a few thousand bytes can quickly become 10 megabits of data with a few picture attachments. Although it may not look all the big on your screen, this type of E-mail can suck up some serious bandwidth when being transmitted. In fact, left unmolested, this type of transfer will take as much bandwidth as is available in transit. On a T1 circuit, a 10-megabit E-mail attachment may bring the line to a standstill for as long as six seconds or more. If you were talking on a Skype call while somebody at the same time shoots a picture E-mail to a friend, your Skype call is most likely going to break up for five seconds or so. It is for this reason that many network operators on shared networks deploy some form of bandwidth contorl or QoS as most would agree an E-mail attachment should not take priority over a live phone call.

E-mail with PDf Attachment

As a rule, PDF files are not as large as picture attachments when it comes to E-mail traffic. An average PDF file runs in the range of 200 thousand bytes whereas today’s higher resolution digital cameras create pictures of a few million bytes, or roughly 10 times larger. On a T1 circuit, the average bandwidth of the PDF file over a few seconds will be around 100kbs, which leaves plenty of room for other activities. The exception would be the 20-page manual which would be crashing your entire T1 for a few seconds just as the large picture attachments referred to above would do.

Gaming/World of Warcraft

There are quite a few blogs that talk about how well World of Warcraft runs on DSL, cable, etc., but most are missing the point about this game and games in general and their actual bandwidth requirements. Most gamers know that ping times are important, but what exactly is the correlation between network speed and ping time?

The problem with just measuring speed is that most speed tests start a stream of packets from a server of some kind to your home computer, perhaps a 20-megabit test file. The test starts (and a timer is started) and the file is sent. When the last byte arrives, a timer is stopped. The amount of data sent over the elapsed seconds yields the speed of the link. So far so good, but a fast speed in this type of test does not mean you have a fast ping time. Here is why.

Most people know that if you are talking to an astronaut on the moon there is a delay of several seconds with each transmission. So, even though the speed of the link is the speed of light for practical purposes, the data arrives several seconds later. Well, the same is true for the Internet. The data may be arriving at a rate of 10 megabits, but the time it takes in transit could be as high as 1 second. Hence, your ping time (your mouse click to fire your gun) does not show up at the controlling server until a full second has elapsed. In a quick draw gun battle, this could be fatal.

So, what affects ping times?

The most common cause would be a saturated network. This is when your network transmission rates of all data on your Internet link exceed the links rated capacity. Some links like a T1 just start dropping packets when full as there is no orderly line to send out waiting packets. In many cases, data that arrive to go out of your router when the link is filled just get tossed. This would be like killing off excess people waiting at a ticket window or something. Not very pleasant.

If your router is smart, it will try to buffer the excess packets and they will arrive late. Also, if the only thing running on your network is World of Warcraft, you can actually get by with 120kbs in many cases since the amount of data actually sent of over the network is not that large. Again, the ping time is more important and a 120kbs link unencumbered should have ping times faster than a human reflex.

There may also be some inherent delay in your Internet link beyond your control. For example, all satellite links, no matter how fast the data speed, have a minimum delay of around 300 milliseconds. Most urban operators do not need to use satellite links, but they all have some delay. Network delay will vary depending on the equipment your provider has in their network, and also how and where they connect up to other providers as well as the amount of hops your data will take. To test your current ping time, you can run a ping command from a standard Windows machine

Citrix

Applications vary widely in the amount of bandwidth consumed. Most mission critical applications using Citrix are fairly lightweight.

YouTube Video — Standard Video

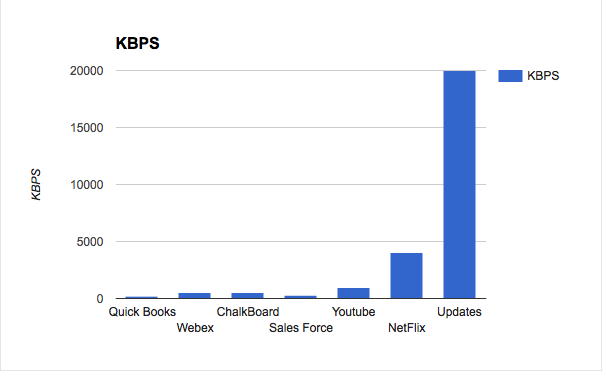
A sustained YouTube video will consume about 500kbs on average over the video’s 10-minute duration. Most video players try to store the video up locally as fast as they can take it. This is important to know because if you are sizing a T1 to be shared by voice phones, theoretically,  if a user was watching a YouTube video, you would have 1 -megabit left over for the voice traffic. Right? Well, in reality, your video player will most likely take the full T1, or close to it, if it can while buffering YouTube.

YouTube — HD Video

On average, YouTube HD consumes close to 1 megabit.

See these other Youtube articles for more specifics about YouTube consumption

Netflix – Movies On Demand

Netflix is moving aggressively to a model where customers download movies over the Internet, versus having a DVD sent to them in the mail.  In a recent study, it was shown that 20% of bandwidth usage during peak in the U.S. is due to Netflix downloads. An average a two hour movie takes about 1.8 gigabits, if you want high-definition movies then its about 3 gigabits for two hours.   Other estimates are as high as 3-5 gigabits per movie.

On a T1 circuit, the average bandwidth of a high-definition Netflix movie (conversatively 3 gigabits/2 hours) over one second will be around 400kbs, which consumes more than 25% of the total circuit.

Skype/VoIP Calls

The amount of bandwidth you need to plan for a VoIP network is a hot topic. The bottom line is that VoIP calls range from 8kbs to 64kbs. Normally, the higher the quality the transmission, the higher the bit rate. For example, at 64kbs you can also transmit with the quality that one might experience on an older style AM radio. At 8kbs, you can understand a voice if the speaker is clear and pronunciates  their words clearly.  However, it is not likely you could understand somebody speaking quickly or slurring their words slightly.

Real-Time Music, Streaming Audio and Internet Radio

Streaming audio ranges from about 64kbs to 128kbs for higher fidelity.

File Transfer Protocol (FTP)/Microsoft Servicepack Downloads

Updates such as Microsoft service packs use file transfer protocol. Generally, this protocol will use as much bandwidth as it can find. There are several limiting factors for the actual speed an FTP will attain, though.

  1. The speed of your link — If the factors below (2 and 3) do not come into effect, an FTP transfer will take your entire link and crowd out VoIP calls and video.
  2. The speed of the senders server — There is no guarantee that the  sending serving is able to deliver data at the speed of your high speed link. Back in the days of dial-up 28.8kbs modems, this was never a factor. But, with some home internet links approaching 10 megabits, don’t be surprised if the sending server cannot keep up. During peak times, the sending server may be processing many requests at one time, and hence, even though it’s coming from a commercial site, it could actually be slower than your home network.
  3. The speed of the local receiving machine — Yes, even the computer you are receiving the file on has an upper limit. If you are on a high speed university network, the line speed of the network can easily exceed your computers ability to take up data.

While every network will ultimately be different, this field guide should provide you with an idea of the bandwidth demands your network will experience. After all, it’s much better to plan ahead rather than risking a bandwidth overload that causes your entire network to come to a hault.

Related Article a must read for anybody upgrading their Internet Pipe is our article on Contention Ratios

Created by APconnections, the NetEqualizer is a plug-and-play bandwidth control and WAN/Internet optimization appliance that is flexible and scalable. When the network is congested, NetEqualizer’s unique “behavior shaping” technology dynamically and automatically gives priority to latency sensitive applications, such as VoIP and email. Click here for a full price list.

Other products that classify bandwidth

White Paper: A Simple Guide to Network Capacity Planning


After many years of consulting and supporting the networking world with WAN optimization devices, we have sensed a lingering fear among Network Administrators who wonder if their capacity is within the normal range.

So the question remains:

How much bandwidth can you survive with before you impact morale or productivity?

The formal term we use to describe the number of users sharing a network link to the Internet is  contention ratio. This term  is defined as  the size of an Internet trunk divided by the number of users. We normally think of Internet trunks in units of megabits. For example, 10 users sharing a one megabit trunk would have a 10-to- 1 contention ratio. If sharing the bandwidth on the trunk equally and simultaneously, each user could sustain a constant feed of 100kbs, which is exactly 1/10 of the overall bandwidth.

From a business standpoint, it is whatever a customer will put up with and pay for without canceling their service. This definition may seem ethically suspect, but whether in the bygone days of telecommunications phone service or contemporary Internet bandwidth business, there are long-standing precedents for overselling. What do you think a circuit busy signal is caused by? Or a dropped cell phone call?

So, without pulling any punches, what exactly will a customer tolerate before pulling the plug?

Here are some basic observations about consumers and acceptable contention ratios:

  • Rural customers in the US and Canada: Contention ratios of 50 to 1 are common
  • International customers in remote areas of the world: Contention ratios of 80 to 1 are common
  • Internet providers in urban areas: Contention ratios of 15 to 1 are to be expected
  • Generic Business ratio 50 to 1 , and sometimes higher

Update Jan 2015, quite a bit has happened since these original numbers were published. Internet prices have plummeted, here is my updated observation.

Rural customers in the US and Canada: Contention ratios of 10 to 1 are common
International customers in remote areas of the world: Contention ratios of 20 to 1 are common
Internet providers in urban areas: Contention ratios of 2 to 1 are to be expected
Generic Business ratio 5 to 1 , and sometimes higher

As a rule Businesses can general get away with slightly higher contention ratios.  Most business use does not create the same load as recreational use, such as YouTube and File Sharing. Obviously, many businesses will suffer the effects of recreational use and perhaps haphazardly turn their heads on enforcement of such use. The above ratio of 50 to 1 is a general guideline of what a business should be able to work with, assuming they are willing to police their network usage and enforce policy.

The numbers above are a good, rough starting point, but things are not as simple as they look. There is a statistical twist as bandwidth amounts get higher.

Contention ratios can actually increase as the overall Internet trunk size gets larger. For example, if 50 people can share one megabit without mutiny, it should follow that 100 people can share two megabits without mutiny as the ratio has not changed. It is still 50 to 1.

However, from observations of hundreds of ISPs, we can easily conclude that perhaps 110 people can share two megabits with the same tolerance as 50 people sharing one megabit. What this means is that the larger the ISP, the more bandwidth at a fixed cost per megabit, and thus the larger the contention ratios you can get away with.

Is this really true? And if so, what are its implications for your business?

This is simply an empirical observation, backed up by talking to literally thousands of ISPs over the course of four years and noticing how their oversubscription ratios increase with the size of their trunk.

A conservative estimate is that, starting with the baseline ratio listed above, you can safely add 10 percent more subscribers above and beyond the original contention ratio for each megabit of trunk they share.

Thus, to provide an illustration, 50 people sharing one megabit can safely be increased to 110 people sharing two megabits, and at four megabits you can easily handle 280 customers. With this understanding, getting more from your bandwidth becomes that much easier.

I also ran across this thread in a discussion group for Resnet Adminstrators around the country.

From Resnet Listserv

Brandon  Enright at University of California San Diego breaks it down as follows:
Right now we’re at .2 Mbps per student.  We could go as low as .1 right
now without much of any impact.  Things would start to get really ugly
for us at .05 Mpbs / student.

So at 10k students I think our lower-bound is 500 Mbps.

I can’t disclose what we’re paying for bandwidth but even if we fully
saturated 2Gbps for the 95% percentile calculation it would come out to
be less than $5 per student per month.  Those seem like reasonable
enough costs to let the students run wild.
Brandon

Editors note: I am not sure why a public institution can’t  exactly disclose what they are paying for bandwidth ( Brian does give a good hint), as this would be useful to the world for comparison; however many Universities get lower than commercial rates through state infrastructure not available to private operators.

Related Article ISP contention ratios.

By Art Reisman

Art Reisman CTO www.netequalizer.com

Editor’s note: Art Reisman is the CTO of APconnections. APconnections designs and manufactures the popular NetEqualizer bandwidth shaper.

%d bloggers like this: