
Update Feb 2014
The spread sheet reporting features described below as an excel Integration have now been integrated into the NetEqualizer GUI as of 2013. We have also added protocol reporting for common applications. We generally do not break links to old articles hence we did not take this article down.
Have you ever wanted an inexpensive real-time bandwidth reporting tool?
The following excel integration, totally opens up the power of the NetEqualizer bandwidth data. Even I love watching my NetEqualizer data on my spreadsheet. Last night, I had it up and watched as the bandwidth spiked all of a sudden, so I looked around to see why it was – turns out my son started watching NetFlix on his Nintendo DS! Too funny, but very persuasive in terms of enhancing your ability to do monitoring.
This blog shows just one example, but suffice it to say that the reporting options are endless. You could easily write a VBA routine in Excel to bring this data down every second. You could automatically log the days top 10 highest streams, or top 10 highest connections. You could graph the last 60 seconds (or other timeframe) of per second peak usage. You could update this graph, watching it scroll by in real time. It’s endless what you could do, with relatively little effort (because Excel does all the computationally hard work as pre-programmed routines for reporting and display).
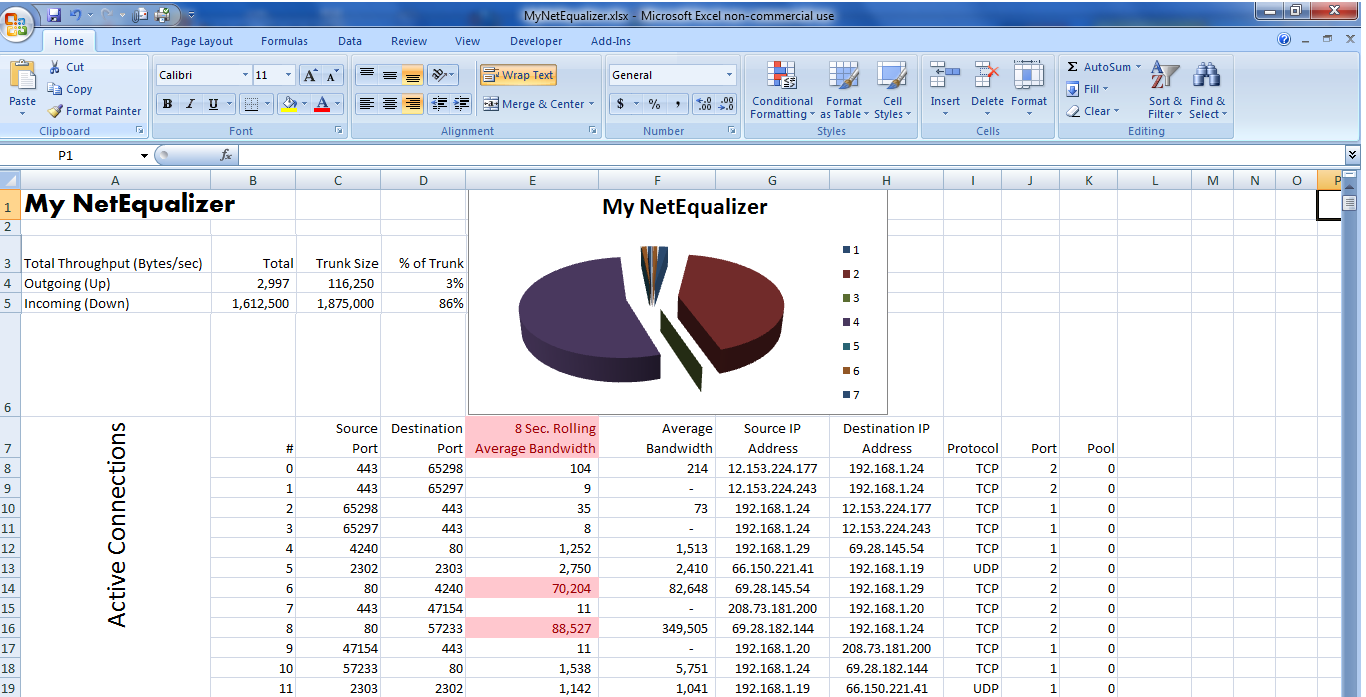
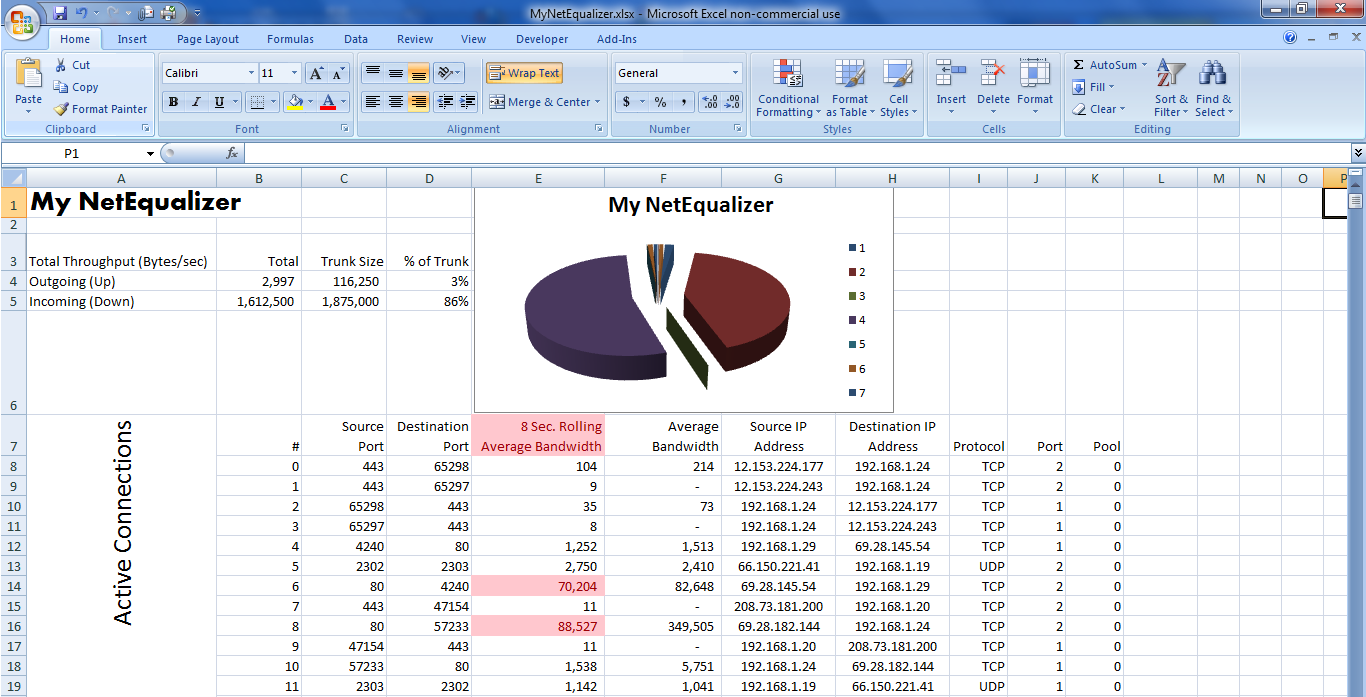
Here’s a picture of what’s happening on my NetEqualizer right now as I write this:

Pretty slick eh? After I put this spreadsheet together the first time, I won’t have to do anything to have it report current data every minute or sooner. Let me explain how you can do it too.
Did you know that there’s a little known feature in Microsoft Excel called an Excel Web Query? This facility allows you to specify an http: address on the web and use the data off the resulting web page for automatic insertion into Excel. Further, you can tell Excel that you want your spreadsheet to be automatically updated regularly – as frequently as every minute or whenever you hit the “Refresh All” key. If you combine this capability with the ability to run a NetEqualizer report from your browser using the embedded command, you can automatically download just about any NetEqualizer data into a spreadsheet for reporting, graphing and analysis.
Fig-1 above shows some interesting information all of it gathered from my NetEqualizer as well as some information that has been programmed into my spreadsheet. Here’s what’s going on: Cells B4 & B5 contain information pulled from my NetEqualizer, it is the total bandwidth Up & Down respectively going through the unit right now. It compares this with cells C4 & C5, which are the TrunkUp & TrunkDown settings (also pulled from the NetEqualizer’s configuration file and downloaded automatically) and calculates cells D4 & D5 showing the % of trunk used. The Cells B8:K show all the data from the NetEqualizer’s Active Connections Report. The column titled “8 Second Rolling Average Bandwidth” shows Wavg and this data is also automatically plotted in a pie chart showing the bandwidth composition of my individual flows. Also, I put a conditional rule on my bandwidth flow that says because I’m greater than 85% of my TrunkDown speed, all Flows greater than HOGMIN should be highlighted in Red. All of this updated every minute, or sooner if I hit the refresh key.
I’ll take you through a step by step on how I created the page above so you unlock the power of Excel on your critical bandwidth data.
The steps I outline are for Excel 2007, this can be done in earlier versions of Excel but the steps will be slightly different. All I ask is if you create a spreadsheet like this and do something you really like, let us know about it (email: sales@apconnections.net).
I’m going to assume that you know how to construct a basic spreadsheet. This document would be far too long if I took you through each little step to create the report above. Instead, I’ll show you the important part – how to get the data from the NetEqualizer into the spreadsheet and have it automatically and regularly refresh itself.
In this page there are two links: One at B4:B5, and another at B8:K (K has no ending row because it depends on how many connections it pulls – thus K could range from K8 to K99999999 – you get the idea).
Let’s start by linking my total up and down bandwidth to cells B4:B5 from the NetEqualizer. To do this, follow these steps:
Select cell B4 with your cursor.
Select the “Data” tab and click “From Web”.

Click “No” and Erase the address in the address bar:

Put the following in the Address Bar instead – make sure to put the IP Address of your NetEqualizer instead of “YourNetEqualizersIPAddress” – and hit return:
—Please contact us (support@apconnections.net) if you are a current NetEqualizer user and want the full doc—
You may get asked for your User ID and Password – just use your normal NetEqualizer User ID and Password.
Now you should see this:

Click on the 2nd arrow in the form which turns it into a check mark after it’s been clicked (as shown in the picture above). This highlights the data returned which is the “Peak” bandwidth (Up & Down) on the NetEqualizer . Click the Import button. In a few seconds this will populate the spreadsheet with this data in cells B4 & B5.
Now, let’s tell the connection that we want the data updated every 1 minute. Right Click on B4 (or B5), and you will see this:

Click on Data Range Properties.
Change “Refresh every” to 1 minute. Also, you should copy the other click marks as well. Hit “OK”.

Done! Total Bandwidth flow data from the NetEqualizer bridge will now automatically update into the spreadsheet every 60 seconds.
For the Active Connections portion of this report, follow the same instructions starting by selecting cell B8. Only for this report, use the following web address (remember to use your NetEqualizer’s IP):
—Please contact us (support@apconnections.net) if you are a current NetEqualizer user and want the full doc—
(note: we’ve had some reports that this command doesn’t cut and paste well probably because of the “wrap”, you may need to type it in)
Also, please copy and paste this exactly (unless you’re a Linux expert – and if you are send me a better command!) since there are many special formatting characters that have been used to make this import work in a well behaved manner. Trust me on this, there was plenty of trial an error spent on getting this to come in reliably.
Also, remember to set the connection properties to update every 1 minute.
At this point you may be noticing one of the cool things about this procedure is that I can run my own “custom” reports via a web http address that also issues Linux commands like “cat” & “awk” – being able to do this allows me to take just about any data off the NetEqualizer for automatic import into Excel.
So that’s how it’s done. Here’s a list of a few other handy web connection reports:
For your NetEqualizer’s configuration file use:
—Please contact us (support@apconnections.net) if you are a current NetEqualizer user and want the full doc—
For your NetEqualizer’s log file use:
—Please contact us (support@apconnections.net) if you are a current NetEqualizer user and want the full doc—
(note: we’ve had some reports that this command doesn’t cut and paste well probably because of the “wrap”, you may need to type it in)
Once you get all the data you need into your Excel, you can operate on the data using any Excel commands including macros, or Excel Visual Basic.
Lastly, do you want to see what’s happening right now, and you don’t want to wait up to 60 seconds? Hit the “Refresh All” button on the “Data” tab – that will refresh everything as of this second:

Good luck, and let us know how it goes…
Caveat – this feature is unsupported by APConnections.


September 19, 2011 at 11:36 AM
[…] Dynamic Reporting With The NetEqualizer […]
October 12, 2011 at 1:46 PM
[…] early August, we posted an article on our blog that discussed how you could generate real-time reports using Excel and your […]
March 21, 2012 at 12:39 PM
[…] March 21, 2012 — netequalizer A few months back we published a blog article called “Dynamic Reporting With The NetEqualizer” that showed how you could link Microsoft Excel ™ to a NetEqualizer and pull all sorts of […]
April 4, 2012 at 1:46 PM
[…] Posts Nine Tips And Tricks To Speed Up Your Internet ConnectionSoftware UpdatesSupport ArchivesDynamic Reporting With The NetEqualizerWhat Is Burstable Bandwidth? Five Points to […]
May 19, 2013 at 2:02 PM
[…] of our most popular unpublished tools that we release to customers who request it is our Dynamic Real-Time Reporting tool which sends data from your NetEqualizer to Excel so that you can monitor usage from your local […]