Most speed test sites measure the download speed of a large file from a server to your computer. There are two potential problems with using this metric.
- ISPs can design their networks so these tests show best case results
- Humans are much more sensitive to the load time of interactive sites.
A better test of your perceived speed is how long it takes to load up a new web page.
If you have a MAC/ Linux server in your house (or windows with Perl installed) you can use this simple tool to measure and chart the time it takes to load a random Web page.
The code below is a Perl script which samples the CNN home page every 5 seconds and records the time it takes to load. The data is stored away in a file called /tmp/xlog.
#! /usr/bin/perl -w
$julian=`date +\”%s\”`;
print $julian;
$verbose=0;
open ($LOGF , ‘>’, “/tmp/xlog”);
for ($i=0; $i < 60 ; $i=$i+1)
{
sleep 5;
$julian=`date +\”%s\”`;
print $julian;
system(“{ time -p curl -o output.txt http://www.cnn.com 2>/dev/null; } 2> x”);
system ( “cat x | grep real > x2″);
$line= `cat x2`;
chomp($line);
@specials=split(” “,$line);
print “$specials[0] $specials[1] “;
print $LOGF “$specials[1] , $julian”;
}
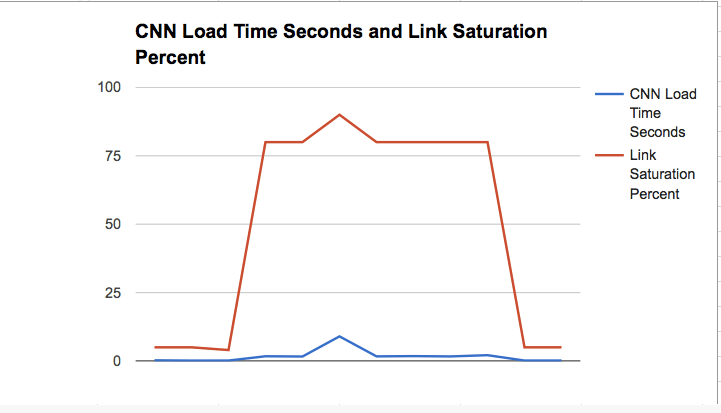
I then took the raw data from my file and charted it using google docs.
Note: I had to use another tool to get the link saturation , and match that up in the chart separately, but even if you don’t have your raw link saturation metrics available, you can see the actual load time it takes to bring up the CNN page using the data generated by the script below.
Notice, my load time was pretty quick at first, but then I started a big download from Knoppix and with my link saturated you can see this severely degraded the CNN load time , peaking out at 9 seconds.


How to Make Your Own Speed Test Tool
February 17, 2016 — netequalizerMost speed test sites measure the download speed of a large file from a server to your computer. There are two potential problems with using this metric.
A better test of your perceived speed is how long it takes to load up a new web page.
If you have a MAC/ Linux server in your house (or windows with Perl installed) you can use this simple tool to measure and chart the time it takes to load a random Web page.
The code below is a Perl script which samples the CNN home page every 5 seconds and records the time it takes to load. The data is stored away in a file called /tmp/xlog.
#! /usr/bin/perl -w
$julian=`date +\”%s\”`;
print $julian;
$verbose=0;
open ($LOGF , ‘>’, “/tmp/xlog”);
for ($i=0; $i < 60 ; $i=$i+1)
{
sleep 5;
$julian=`date +\”%s\”`;
print $julian;
system(“{ time -p curl -o output.txt http://www.cnn.com 2>/dev/null; } 2> x”);
system ( “cat x | grep real > x2″);
$line= `cat x2`;
chomp($line);
@specials=split(” “,$line);
print “$specials[0] $specials[1] “;
print $LOGF “$specials[1] , $julian”;
}
I then took the raw data from my file and charted it using google docs.
Note: I had to use another tool to get the link saturation , and match that up in the chart separately, but even if you don’t have your raw link saturation metrics available, you can see the actual load time it takes to bring up the CNN page using the data generated by the script below.
Notice, my load time was pretty quick at first, but then I started a big download from Knoppix and with my link saturated you can see this severely degraded the CNN load time , peaking out at 9 seconds.
Share this: