
|
|||||||||||||||||||
Our Website Contact Us NetEqualizer Demo Price List Join Our Mailing List
|
|||||||||||||||||||


NetEqualizer News: September 2011
September 19, 2011 — netequalizer
|
||||||||||||||||||||||||||||||||


![]()
NetEqualizer expects to gain market share in recession
August 4, 2011 — netequalizerLafayette Colorado
APconnections released a statement today saying that they expect to gain market share in the highly competitive bandwidth control and WAN optimization market should there be another downturn in the world economy.
“We obviously don’t wish a recession on anybody. The main reason for our success in a tight market is our low price. In good times some customers are hesitant to contact us because they believe that our lower pricing model just can’t be true without a gimmick. When a recession comes along, businesses are still faced with the problem of a congested Internet link with less operating dollars available to spend. Next thing we know is that our phone starts ringing with inquiries, followed by new customers opting to trial the NetEqualizer.” The cautious inquirer soon turns into an NetEqualizer advocate, as per the comment below.
In the UK there is an advertising slogan for paint that says: ”It does exactly what it says on the tin”. Well the NetEqualizer does exactly what they claim on their website: we took it out of the box, plugged it in to our network, and 10 minutes later, all our bandwidth problems disappeared. No more dropped VoIP calls, and no more complaints about slow internet access or stuck emails. We did get a couple of unhappy users – but those were the folks who were downloading movies on peer-to-peer or running unauthorised web-servers on our network – and they had caused all the trouble for everyone! NetEqualizer was automatically throttling back their bandwidth usage. Easy. We have 100 tenants in our serviced office, and the internet just HAS to work 24/7 – NetEqualizer has made them, and us, happy!
Related Article Does Lower cost bandwidth foretell a drop off in expensive Packet Shapers
Dynamic Reporting With The NetEqualizer
August 3, 2011 — netequalizerUpdate Feb 2014
The spread sheet reporting features described below as an excel Integration have now been integrated into the NetEqualizer GUI as of 2013. We have also added protocol reporting for common applications. We generally do not break links to old articles hence we did not take this article down.
Have you ever wanted an inexpensive real-time bandwidth reporting tool?
The following excel integration, totally opens up the power of the NetEqualizer bandwidth data. Even I love watching my NetEqualizer data on my spreadsheet. Last night, I had it up and watched as the bandwidth spiked all of a sudden, so I looked around to see why it was – turns out my son started watching NetFlix on his Nintendo DS! Too funny, but very persuasive in terms of enhancing your ability to do monitoring.
This blog shows just one example, but suffice it to say that the reporting options are endless. You could easily write a VBA routine in Excel to bring this data down every second. You could automatically log the days top 10 highest streams, or top 10 highest connections. You could graph the last 60 seconds (or other timeframe) of per second peak usage. You could update this graph, watching it scroll by in real time. It’s endless what you could do, with relatively little effort (because Excel does all the computationally hard work as pre-programmed routines for reporting and display).
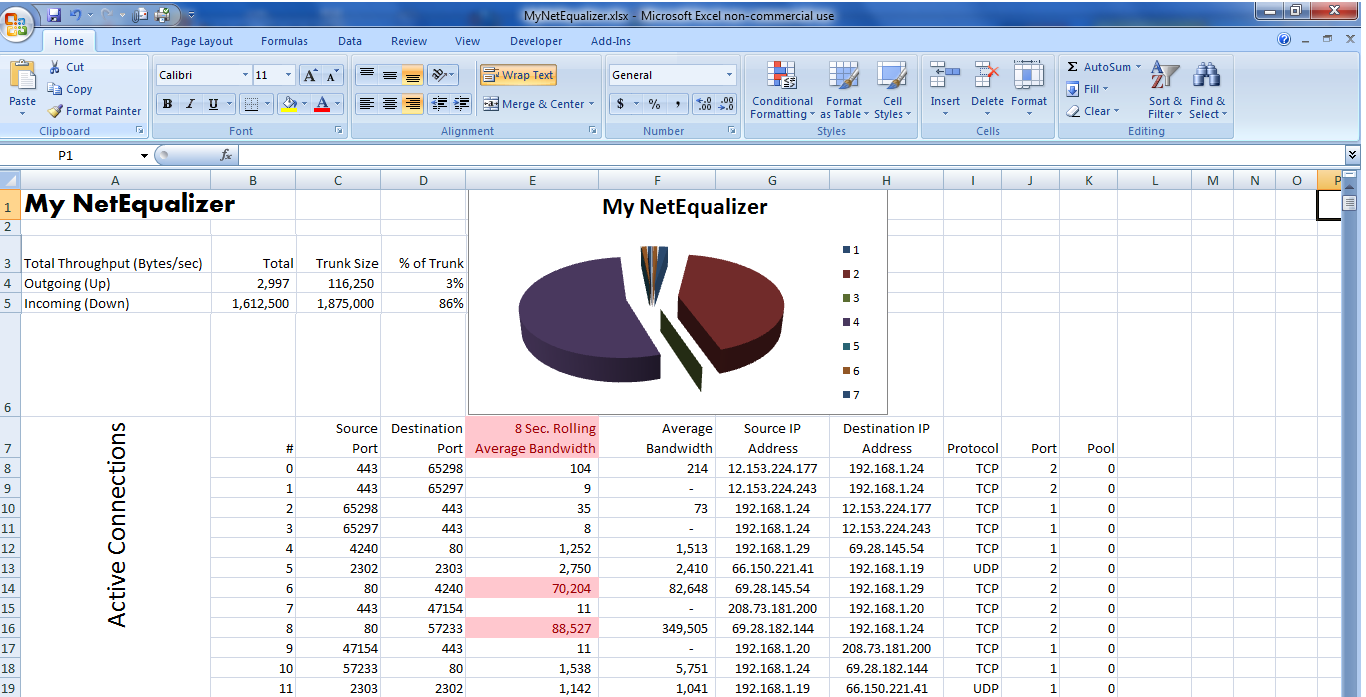
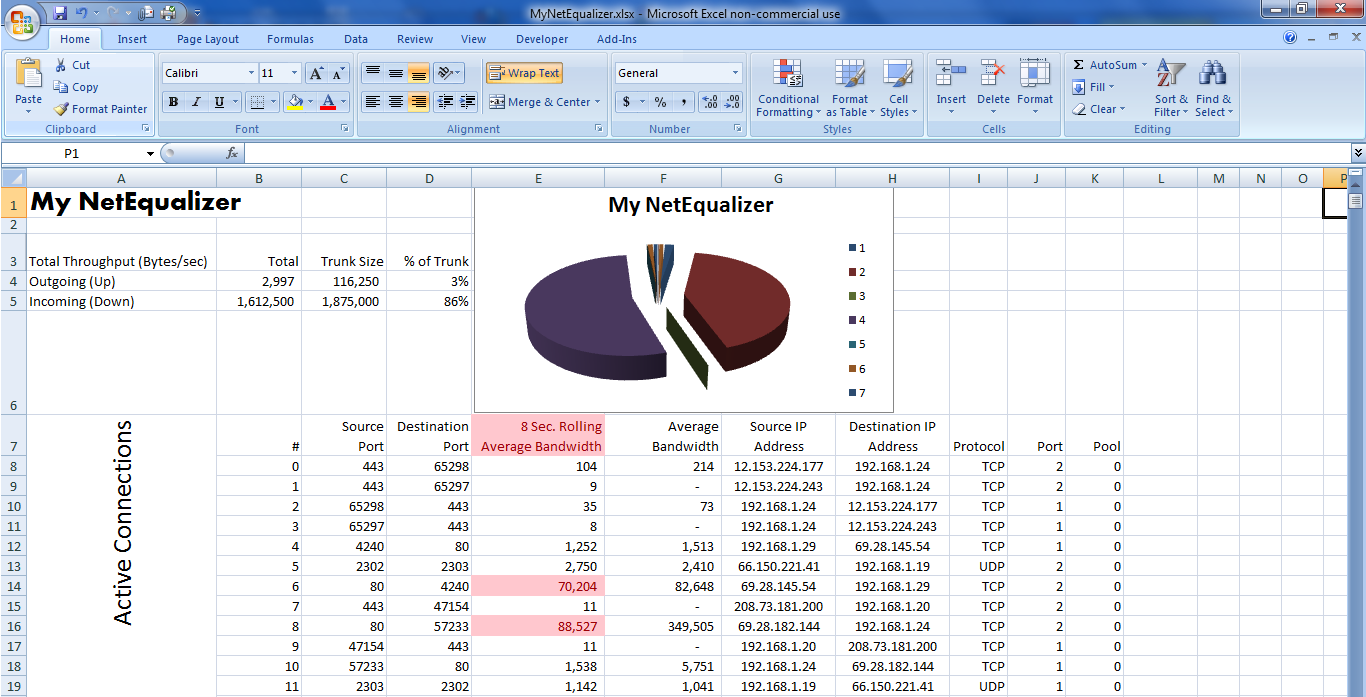
Here’s a picture of what’s happening on my NetEqualizer right now as I write this:

Pretty slick eh? After I put this spreadsheet together the first time, I won’t have to do anything to have it report current data every minute or sooner. Let me explain how you can do it too.
Did you know that there’s a little known feature in Microsoft Excel called an Excel Web Query? This facility allows you to specify an http: address on the web and use the data off the resulting web page for automatic insertion into Excel. Further, you can tell Excel that you want your spreadsheet to be automatically updated regularly – as frequently as every minute or whenever you hit the “Refresh All” key. If you combine this capability with the ability to run a NetEqualizer report from your browser using the embedded command, you can automatically download just about any NetEqualizer data into a spreadsheet for reporting, graphing and analysis.
Fig-1 above shows some interesting information all of it gathered from my NetEqualizer as well as some information that has been programmed into my spreadsheet. Here’s what’s going on: Cells B4 & B5 contain information pulled from my NetEqualizer, it is the total bandwidth Up & Down respectively going through the unit right now. It compares this with cells C4 & C5, which are the TrunkUp & TrunkDown settings (also pulled from the NetEqualizer’s configuration file and downloaded automatically) and calculates cells D4 & D5 showing the % of trunk used. The Cells B8:K show all the data from the NetEqualizer’s Active Connections Report. The column titled “8 Second Rolling Average Bandwidth” shows Wavg and this data is also automatically plotted in a pie chart showing the bandwidth composition of my individual flows. Also, I put a conditional rule on my bandwidth flow that says because I’m greater than 85% of my TrunkDown speed, all Flows greater than HOGMIN should be highlighted in Red. All of this updated every minute, or sooner if I hit the refresh key.
I’ll take you through a step by step on how I created the page above so you unlock the power of Excel on your critical bandwidth data.
The steps I outline are for Excel 2007, this can be done in earlier versions of Excel but the steps will be slightly different. All I ask is if you create a spreadsheet like this and do something you really like, let us know about it (email: sales@apconnections.net).
I’m going to assume that you know how to construct a basic spreadsheet. This document would be far too long if I took you through each little step to create the report above. Instead, I’ll show you the important part – how to get the data from the NetEqualizer into the spreadsheet and have it automatically and regularly refresh itself.
In this page there are two links: One at B4:B5, and another at B8:K (K has no ending row because it depends on how many connections it pulls – thus K could range from K8 to K99999999 – you get the idea).
Let’s start by linking my total up and down bandwidth to cells B4:B5 from the NetEqualizer. To do this, follow these steps:
Select cell B4 with your cursor.
Select the “Data” tab and click “From Web”.

Click “No” and Erase the address in the address bar:

Put the following in the Address Bar instead – make sure to put the IP Address of your NetEqualizer instead of “YourNetEqualizersIPAddress” – and hit return:
—Please contact us (support@apconnections.net) if you are a current NetEqualizer user and want the full doc—
You may get asked for your User ID and Password – just use your normal NetEqualizer User ID and Password.
Now you should see this:

Click on the 2nd arrow in the form which turns it into a check mark after it’s been clicked (as shown in the picture above). This highlights the data returned which is the “Peak” bandwidth (Up & Down) on the NetEqualizer . Click the Import button. In a few seconds this will populate the spreadsheet with this data in cells B4 & B5.
Now, let’s tell the connection that we want the data updated every 1 minute. Right Click on B4 (or B5), and you will see this:

Click on Data Range Properties.
Change “Refresh every” to 1 minute. Also, you should copy the other click marks as well. Hit “OK”.

Done! Total Bandwidth flow data from the NetEqualizer bridge will now automatically update into the spreadsheet every 60 seconds.
For the Active Connections portion of this report, follow the same instructions starting by selecting cell B8. Only for this report, use the following web address (remember to use your NetEqualizer’s IP):
—Please contact us (support@apconnections.net) if you are a current NetEqualizer user and want the full doc—
(note: we’ve had some reports that this command doesn’t cut and paste well probably because of the “wrap”, you may need to type it in)
Also, please copy and paste this exactly (unless you’re a Linux expert – and if you are send me a better command!) since there are many special formatting characters that have been used to make this import work in a well behaved manner. Trust me on this, there was plenty of trial an error spent on getting this to come in reliably.
Also, remember to set the connection properties to update every 1 minute.
At this point you may be noticing one of the cool things about this procedure is that I can run my own “custom” reports via a web http address that also issues Linux commands like “cat” & “awk” – being able to do this allows me to take just about any data off the NetEqualizer for automatic import into Excel.
So that’s how it’s done. Here’s a list of a few other handy web connection reports:
For your NetEqualizer’s configuration file use:
—Please contact us (support@apconnections.net) if you are a current NetEqualizer user and want the full doc—
For your NetEqualizer’s log file use:
—Please contact us (support@apconnections.net) if you are a current NetEqualizer user and want the full doc—
(note: we’ve had some reports that this command doesn’t cut and paste well probably because of the “wrap”, you may need to type it in)
Once you get all the data you need into your Excel, you can operate on the data using any Excel commands including macros, or Excel Visual Basic.
Lastly, do you want to see what’s happening right now, and you don’t want to wait up to 60 seconds? Hit the “Refresh All” button on the “Data” tab – that will refresh everything as of this second:

Good luck, and let us know how it goes…
Caveat – this feature is unsupported by APConnections.
NetEqualizer News: August 2011
August 3, 2011 — netequalizer|
|
|
|||||||||||||||||||||||||

YouTube Dominates Video Viewership in U.S.
July 29, 2011 — netequalizerEditor’s Note: Updated July 27th, 2011 with material from www.pewinternet.org:
YouTube studies are continuing to confirm what I’m sure we all are seeing – that Americans are creating, sharing and viewing video online more than ever, this according to a Pew Research Center Internet & American Life Project study released Tuesday.
According to Pew, fully 71% of online Americans use video-sharing sites such as YouTube and Vimeo, up from 66% a year earlier. The use of video-sharing sites on any given day also jumped five percentage points, from 23% of online Americans in May 2010 to 28% in May 2011. This figure (28%) is slightly lower than the 33% Video Metrix reported in June, but is still significant.
To download or read the fully study, click on this link: http://pewinternet.org/Reports/2011/Video-sharing-sites/Report.aspx
———————————————————————————————————————————————————
YouTube viewership in May 2011 was approximately 33 percent of video viewed on the Internet in the U.S., according to data from the comScore Video Metrix released on June 17, 2011.
Google sites, driven primarily by video viewing at YouTube.com, ranked as the top online video content property in May with 147.2 million unique viewers, which was 83 percent of the total unique viewers tracked. Google Sites had the highest number of viewing sessions with more than 2.1 billion, and highest time spent per viewer at 311 minutes, crossing the five-hour mark for the first time.
To read more on the data released by comScore, click here. comScore, Inc. (NASDAQ: SCOR) is a global leader in measuring the digital world and preferred source of digital business analytics. For more information, please visit www.comscore.com/companyinfo.
This trend further confirms why our NetEqualizer Caching Option (NCO) is geared to caching YouTube videos. While NCO will cache any file sized from 2MB-40MB traversing port 80, the main target content is YouTube. To read more about the NetEqualizer Caching Option to see if it’s a fit for your organization, read our YouTube Caching FAQ or contact Sales at sales@apconnections.net.
We Want Your Feedback!
July 9, 2011 — netequalizerIn this month’s newsletter, we gave an overview of a few potential new NetEqualizer features. While we have several options under consideration, we want to know what features might serve you best. So, take a look at the options below, visit our survey, and let us know what you think!
- The option to send an SNMP trap to your SNMP monitor during a network event.
- The option to receive email notification during certain specified network events.This could include when:
- Bandwidth utilization is high – This would happen when your bandwidth utilization is extremely high and might indicate the need for an upgrade in bandwidth
- Errors occur on an interface card – This would be used to detect if there was a problem with one of your Ethernet or fiber connections
- A new P2P user is detected on your network – This would make even better and more efficient use of our new P2P Locator Technology
- YouTube has been viewed from cache – An email would be dispatched every time a YouTube video is served up from our NetEqualizer Caching Option
- A form of active directory integration to specify a rate limit on a user by name rather than IP address. For example, you could say John Smith is limited to one-megabit downloads. As of now, you would need to know John Smith’s IP address. With an integration of active directory, you can specify him by name.
- A standard pre-written quota utility (source code) with each system. Right now, the NetEqualizer just comes with an API (see the NetEqualizer User Quota API). However, this new utility would be something you could plug IPs into from the GUI and have a monthly quota enforced right away. Initially, it would be a very simple tool, but it could be expanded. In other words, this would be a good working program using our API to get you a head start on expanding and writing a full-bodied quota tool.
Click here or on the survey to respond.

NetEqualizer News: July 2011
July 7, 2011 — netequalizer
|
|||||||||||||||||||||||||||||||

![]()
Budgeting for Wireless Data on Verizon’s New Plans
July 5, 2011 — netequalizerEditor’s Note: This article from The Associated Press appeared today on Yahoo! Finance. It sheds some light on Verizon’s plans and gives additional details on some of the issues discussed in our article below.
NEW YORK (AP) — Are you a wireless data glutton or a nibbler?
Many Verizon Wireless customers will have to figure that out — perhaps as soon as this week — as the country’s largest wireless carrier is set to introduce data plans with monthly usage caps.
Here’s some help determining which plan will work for you, even if you don’t know how many megabytes are in a gigabyte.
Verizon hasn’t said what its plans will look like. But because AT&T introduced capped data plans a year ago and T-Mobile USA eliminated its unlimited data plan in May, this is well-trod ground.

NetEqualizer News: June 2011
June 1, 2011 — netequalizer
|
||||||||||||||||||||||


NetEqualizer P2P Locator Technology
May 21, 2011 — netequalizerEditor’s Note: The NetEqualizer has always been able to thwart P2P behavior on a network. However, our new utility can now pinpoint an individual P2P user or gamer without any controversial layer-7 packet inspection. This is an extremely important step from a privacy point of view as we can actually spot P2P users without looking at any private data.
A couple of months ago, I was doing a basic health check on a customer’s heavily used residential network. In the process, I instructed the NetEqualizer to take a few live snapshots. I then used the network data to do some filtering with custom software scripts. Within just a few minutes, I was able to inform the administrator that eight users on his network were doing some heavy P2P, and one in particular looked to be hosting a gaming session. This was news to the customer, as his previous tools didn’t provide that kind of detail.
A few days later, I decided to formally write up my notes and techniques for monitoring a live system to share on the blog. But, as I got started, another lightbulb went on…in the end, many customers just want to know the basics — who is using P2P, hosting game servers, etc. They don’t always have the time to follow a manual diagnostic recipe.
So, with this in mind, instead of writing up the manual notes, I spent the next few weeks automating and testing an intelligent utility to provide this information. The utility is now available with NetEqualizer 5.0.
The utility provides:
- A list of users that are suspected of using P2P
- A list of users that are likely hosting gaming servers
- A confidence rating for each user (from high to low)
- The option of tracking users by IP and MAC address
The key to determining a user’s behavior is the analysis of the fluctuations in their connection counts and total number of connections. We take snapshots over a few seconds, and like a good detective, we’ve learned how to differentiate P2P use from gaming, Web browsing and even video. We can do this without using any deep packet inspection. It’s all based on human-factor heuristics and years of practice.
Enclosed is a screen shot of the new P2P Locator, available under our Reports & Graphing menu.

Our new P2P Locator technology
Contact us to learn more about the NetEqualizer P2P Locator Technology or NetEqualizer 5.0. For more information about ongoing changes and challenges with BitTorrent and P2P, see Ars Technica’s “BitTorrent Has New Plan to Shape Up P2P Behavior.”
NetEqualizer News: May 2011
May 10, 2011 — netequalizer
|
|||||||||||||||||||||||||||||||


Setting Up a Squid Proxy Caching Co-Resident with a Bandwidth Controller
April 29, 2011 — netequalizerEditor’s Note: It was a long road to get here (building the NetEqualizer Caching Option (NCO) a new feature offered on the NE3000 & NE4000), and for those following in our footsteps or just curious on the intricacies of YouTube caching, we have laid open the details.
This evening, I’m burning the midnight oil. I’m monitoring Internet link statistics at a state university with several thousand students hammering away on their residential network. Our bandwidth controller, along with our new NetEqualizer Caching Option (NCO), which integrates Squid for caching, has been running continuously for several days and all is stable. From the stats I can see, about 1,000 YouTube videos have been played out of the local cache over the past several hours. Without the caching feature installed, most of the YouTube videos would have played anyway, but there would be interruptions as the Internet link coughed and choked with congestion. Now, with NCO running smoothly, the most popular videos will run without interruptions.
Getting the NetEqualizer Caching Option to this stable product was a long and winding road. Here’s how we got there.
First, some background information on the initial problem.
To use a Squid proxy server, your network administrator must put hooks in your router so that all Web requests go the Squid proxy server before heading out to the Internet. Sometimes the Squid proxy server will have a local copy of the requested page, but most of the time it won’t. When a local copy is not present, it sends your request on to the Internet to get the page (for example the Yahoo! home page) on your behalf. The squid server will then update a local copy of the page in its cache (storage area) while simultaneously sending the results back to you, the original requesting user. If you make a subsequent request to the same page, the Squid will quickly check it to see if the content has been updated since it stored away the first time, and if it can, it will send you a local copy. If it detects that the local copy is no longer valid (the content has changed), then it will go back out to the Internet and get a new copy.
Now, if you add a bandwidth controller to the mix, things get interesting quickly. In the case of the NetEqualizer, it decides when to invoke fairness based on the congestion level of the Internet trunk. However, with the bandwidth controller unit (BCU) on the private side of the Squid server, the actual Internet traffic cannot be distinguished from local cache traffic. The setup looks like this:
Internet->router->Squid->bandwidth controller->users
The BCU in this example won’t know what is coming from cache and what is coming from the Internet. Why? Because the data coming from the Squid cache comes over the same path as the new Internet data. The BCU will erroneously think all the traffic is coming from the Internet and will shape cached traffic as well as Internet traffic, thus defeating the higher speeds provided by the cache.
In this situation, the obvious solution would be to switch the position of the BCU to a setup like this:
Internet->router->bandwidth controller->Squid->users
This configuration would be fine except that now all the port 80 HTTP traffic (cached or not) will appear like it is coming from the Squid proxy server and your BCU will not be able to do things like put rate limits on individual users.
Fortunately, with the our NetEqualizer 5.0 release, we’ve created an integration with NetEqualizer and co-resident Squid (our NetEqualizer Caching Option) such that everything works correctly. (The NetEqualizer still sees and acts on all traffic as if it were between the user and the Internet. This required some creative routing and actual bug fixes to the bridging and routing in the Linux kernel. We also had to develop a communication module between the NetEqualizer and the Squid server so the NetEqualizer gets advance notice when data is originating in cache and not the Internet.)
Which do you need, Bandwidth Control or Caching?
At this point, you may be wondering if Squid caching is so great, why not just dump the BCU and be done with the complexity of trying to run both? Well, while the Squid server alone will do a fine job of accelerating the access times of large files such as video when they can be fetched from cache, a common misconception is that there is a big relief on your Internet pipe with the caching server. This has not been the case in our real world installations.
The fallacy for caching as panacea for all things congested assumes that demand and overall usage is static, which is unrealistic. The cache is of finite size and users will generally start watching more YouTube videos when they see improvements in speed and quality (prior to Squid caching, they might have given up because of slowness), including videos that are not in cache. So, the Squid server will have to fetch new content all the time, using additional bandwidth and quickly negating any improvements. Therefore, if you had a congested Internet pipe before caching, you will likely still have one afterward, leading to slow access for many e-mail, Web chat and other non-cachable content. The solution is to include a bandwidth controller in conjunction with your caching server. This is what NetEqualizer 5.0 now offers.
In no particular order, here is a list of other useful information — some generic to YouTube caching and some just basic notes from our engineering effort. This documents the various stumbling blocks we had to overcome.
1. There was the issue of just getting a standard Squid server to cache YouTube files.
It seemed that the URL tags on these files change with each access, like a counter, and a normal Squid server is fooled into believing the files have changed. By default, when a file changes, a caching server goes out and gets the new copy. In the case of YouTube files, the content is almost always static. However, the caching server thinks they are different when it sees the changing file names. Without modifications, the default Squid caching server will re-retrieve the YouTube file from the source and not the cache because the file names change. (Read more on caching YouTube with Squid…).
2. We had to move to a newer Linux kernel to get a recent of version of Squid (2.7) which supports the hooks for YouTube caching.
A side effect was that the new kernel destabilized some of the timing mechanisms we use to implement bandwidth control. These subtle bugs were not easily reproduced with our standard load generation tools, so we had to create a new simulation lab capable of simulating thousands of users accessing the Internet and YouTube at the same time. Once we built this lab, we were able to re-create the timing issues in the kernel and have them patched.
3. It was necessary to set up a firewall re-direct (also on the NetEqualizer) for port 80 traffic back to the Squid server.
This configuration, and the implementation of an extra bridge, were required to get everything working. The details of the routing within the NetEqualizer were customized so that we would be able to see the correct IP addresses of Internet sources and users when shaping. (As mentioned above, if you do not take care of this, all IPs (traffic) will appear as if they are coming from the Proxy server.
4. The firewall has a table called ConnTrack (not be confused with NetEqualizer connection tracking but similar).
The connection tracking table on the firewall tends to fill up and crash the firewall, denying new requests for re-direction if you are not careful. If you just go out and make the connection table randomly enormous that can also cause your system to lock up. So, you must measure and size this table based on experimentation. This was another reason for us to build our simulation lab.
5. There was also the issue of the Squid server using all available Linux file descriptors.
Linux comes with a default limit for security reasons, and when the Squid server hit this limit (it does all kinds of file reading and writing keeping descriptors open), it locks up.
Tuning changes that we made to support Caching with Squid
a. To limit the file size of a cached object of 2 megabytes (2MB) to 40 megabytes (40MB)
- minimum_object_size 2000000 bytes
- maximum_object_size 40000000 bytes
If you allow smaller cached objects it will rapidly fill up your cache and there is little benefit to caching small pages.
b. We turned off the Squid keep reading flag
- quick_abort_min 0 KB
- quick_abort_max 0 KB
This flag when set continues to read a file even if the user leave the page, for example when watching a video if the user aborts on their browser the Squid cache continues to read the file. I suppose this could now be turned back on, but during testing it was quite obnoxious to see data transfers talking place to the squid cache when you thought nothing was going on.
c. We also explicitly told the Squid what DNS servers to use in its configuration file. There was some evidence that without this the Squid server may bog down, but we never confirmed it. However, no harm is done by setting these parameters.
- dns_nameservers x.x.x.x
d. You have to be very careful to set the cache size not to exceed your actual capacity. Squid is not smart enough to check your real capacity, so it will fill up your file system space if you let it, which in turn causes a crash. When testing with small RAM disks less than four gigs of cache, we found that the Squid logs will also fill up your disk space and cause a lock up. The logs are refreshed once a day on a busy system. With a large amount of pages being accessed, the log will use close to one (1) gig of data quite easily, and then to add insult to injury, the log back up program makes a back up. On a normal-sized caching system there should be ample space for logs
e. Squid has a short-term buffer not related to caching. It is just a buffer where it stores data from the Internet before sending it to the client. Remember all port 80 (HTTP) requests go through the squid, cached or not, and if you attempt to control the speed of a transfer between Squid and the user, it does not mean that the Squid server slows the rate of the transfer coming from the Internet right away. With the BCU in line, we want the sender on the Internet to back off right away if we decide to throttle the transfer, and with the Squid buffer in between the NetEqualizer and the sending host on the Internet, the sender would not respond to our deliberate throttling right away when the buffer was too large (Link to Squid caching parameter).
f. How to determine the effectiveness of your YouTube caching statistics?
I use the Squid client cache statistics page. Down at the bottom there is a entry that lists hits verses requests.
TOTALS
- ICP : 0 Queries, 0 Hits (0%)
- HTTP: 21990877 Requests, 3812 Hits (0%)
At first glance, it may appear that the hit rate is not all that effective, but let’s look at these stats another way. A simple HTTP page generates about 10 HTTP requests for perhaps 80K bytes of data total. A more complex page may generate 500k. For example, when you go to the CNN home page there are quite a few small links, and each link increments the HTTP counter. On the other hand, a YouTube hit generates one hit for about 20 megabits of data. So, if I do a little math based on bytes cached we get, the summary of HTTP hits and requests above does not account for total data. But, since our cache is only caching Web pages from two megabits to 40 megabits, with an estimated average of 20 megabits, this gives us about 400 gigabytes of regular HTTP and 76 Gigabytes of data that came from the cache. Abut 20 percent of all HTTP data came from cache by this rough estimate, which is a quite significant.


NetEqualizer News Special Feature: Technology and Other Predictions for 2012 and Beyond
July 13, 2011 — netequalizerAs we pass the midpoint of 2011, it’s time to start making a few predictions about the year to come. So keep an eye out for these developments over the next 18 months. If we’re right, be sure to give us credit. If we’re wrong, just act like this post never happened. Here are our thoughts…
Prediction #1: Apple or a new player will make a splash in the search engine market. Current search engine technology, although thorough and expansive, tends to be lacking in smarts. How many times have you searched for a page or link that you know for sure is out there, and despite your best efforts of crafting your key words, Google or Yahoo can’t find what you are looking for? Sometimes, unless you know the exact context of a sentence, in correct word order, you just can’t find it. And that leaves room for improvement.
This is not a knock on Google, Yahoo! or Bing, per se, but rather just an observation that there is room for another generation of search engine and somebody is going to do it sooner rather than later. However, we expect the next-generation search engine will sacrifice speed for intelligence. By this we mean that it is likely the newer generation may crank for 20 seconds to find what you are looking for, but the slower speeds will be more than compensated for by the better, more relevant results. New search engine technology will take the market by storm because of more useful content.
The reason why we suspect Apple might solve this puzzle is that Steve Jobs has a habit of leap frogging technology and bringing it to market. Google has grown by acquisition and not so much by innovation. If not Apple, then it might also come out of left field at some graduate research lab. Regardless, we think it will happen.
Prediction #2: There will be a tumble in the social networking and search engine stock bubble. The expectations for advertisement revenue will not pan out. Placement ads are just too easy to ignore on the Internet. These sites do not have the captive audience of the super bowl, and advertisers are starting to figure that out.
There will be price pressure on the content sites and search engine sites to lower costs to attract advertisers as they actually start to measure and go public with their returns on advertising investment. There will be quite a bit of pressure to hide this fact in the media, as there is now, but at some point content advertising revenues ROI will bare this out.
We are not predicting a collapse in this market, but just some major adjustments to valuations. This is based on our six years of experience placing online ads. Prices have gone up and results were never there to justify cost.
Related Article: Facebook Valuation Too High
Related Article: Demand Builds for TV Ad Time
Prediction #3: Fuel prices will plummet as the Chinese and Indian economies cool down.
Although oil production and exploration is flat in the US, every other country around the world is picking up exploration and exploiting new reserves. The market will be flooded with oil by mid or late 2012, sending the price of gasoline back down to $2 or below.
Prediction #4: There will be a new resurgence in urban mesh networks.
Why? These things really do enhance economic activity. The initial round of municipal mesh networks was a learning experiment with some limited success and way too much inexperience in sourcing providers.
The real reason for cities to invest in these networks will be the growing monthly fees with 4G devices that traditional providers are charging to cover the cost of their larger networks. Users will gravitate toward areas where they can switch over to free wireless. A well-covered downtown or small city with free wireless service will be a welcome island for business users and consumers alike. Think of it like a stepping inside a circle where you can make free unlimited long distance calls while the rest of the provider networks gouge you when step outside.
We’ll see how these predictions pan out. As always, feel free to share your thoughts on our predictions, or some predictions of your own, in the comments section below.
In a related article, the WSJ reports Wi-fi is the largest provider for Mobile Devices such as the iPhone.
Share this: